


 Updated
A TradingView footprint chart is a powerful tool that transforms a standard candlestick into a detailed map of market activity. It visualises the distribution of trading volume across different price levels within each candle on a specified timeframe.
Using a footprint chart on TradingView allows you to go beyond simple price movement. It enables you to analyse the specific buying and selling pressure at every price point, offering a level of insight into underlying market behaviour that traditional charts simply cannot provide.
Key Points
- Footprint charts display volume at each price level within a candlestick, offering deeper insight into market activity.
- They help traders identify imbalances, absorption zones, and institutional moves that may not be visible on standard candlestick charts.
- When combined with other tools on TradingView, footprint charts can enhance trade entries, exits, and overall market understanding.
What Is a Footprint Chart?
A footprint chart on TradingView shows how much trading happens at each price level within a single candlestick. It helps traders see where buyers and sellers are most active, giving a clearer picture of what’s happening in the market.
Who Uses a Footprint Chart
Footprint charts are useful for traders looking to identify areas of high liquidity or high trading activity. By analysing the interaction between buyers and sellers, traders may uncover potential opportunities within the market.
Does TradingView Support Footprint Charts?
Yes, TradingView supports footprint charts, although access may depend on your subscription level and the data provider you are using. These charts can be accessed through TradingView’s advanced charting features when connected to supported exchanges that offer detailed volume and order flow data.
How to Access Footprint Charts on TradingView
Users with a Premium or higher-tier TradingView plan can view volume footprint charts by selecting the “Volume Footprint” option from the chart type dropdown menu. For those who would like to explore this feature before subscribing, TradingView offers a free 30-day trial of its Premium plan.
Third-party integrations
A TradingView footprint chart can be integrated with third-party platforms. This offers traders access to real-time data and order book information. Enhanced analysis tools and features may also be available, over and above what can be accessed in TradingView. This may give traders a more comprehensive understanding of trading opportunities and market dynamics.
How to read a TradingView Footprint Chart?
A footprint chart shows the volume traded at each price level within a candlestick, allowing traders to see where buying and selling activity is concentrated. By highlighting imbalances between buyers and sellers, this can help identify areas of market interest, such as support, resistance, or potential reversals.
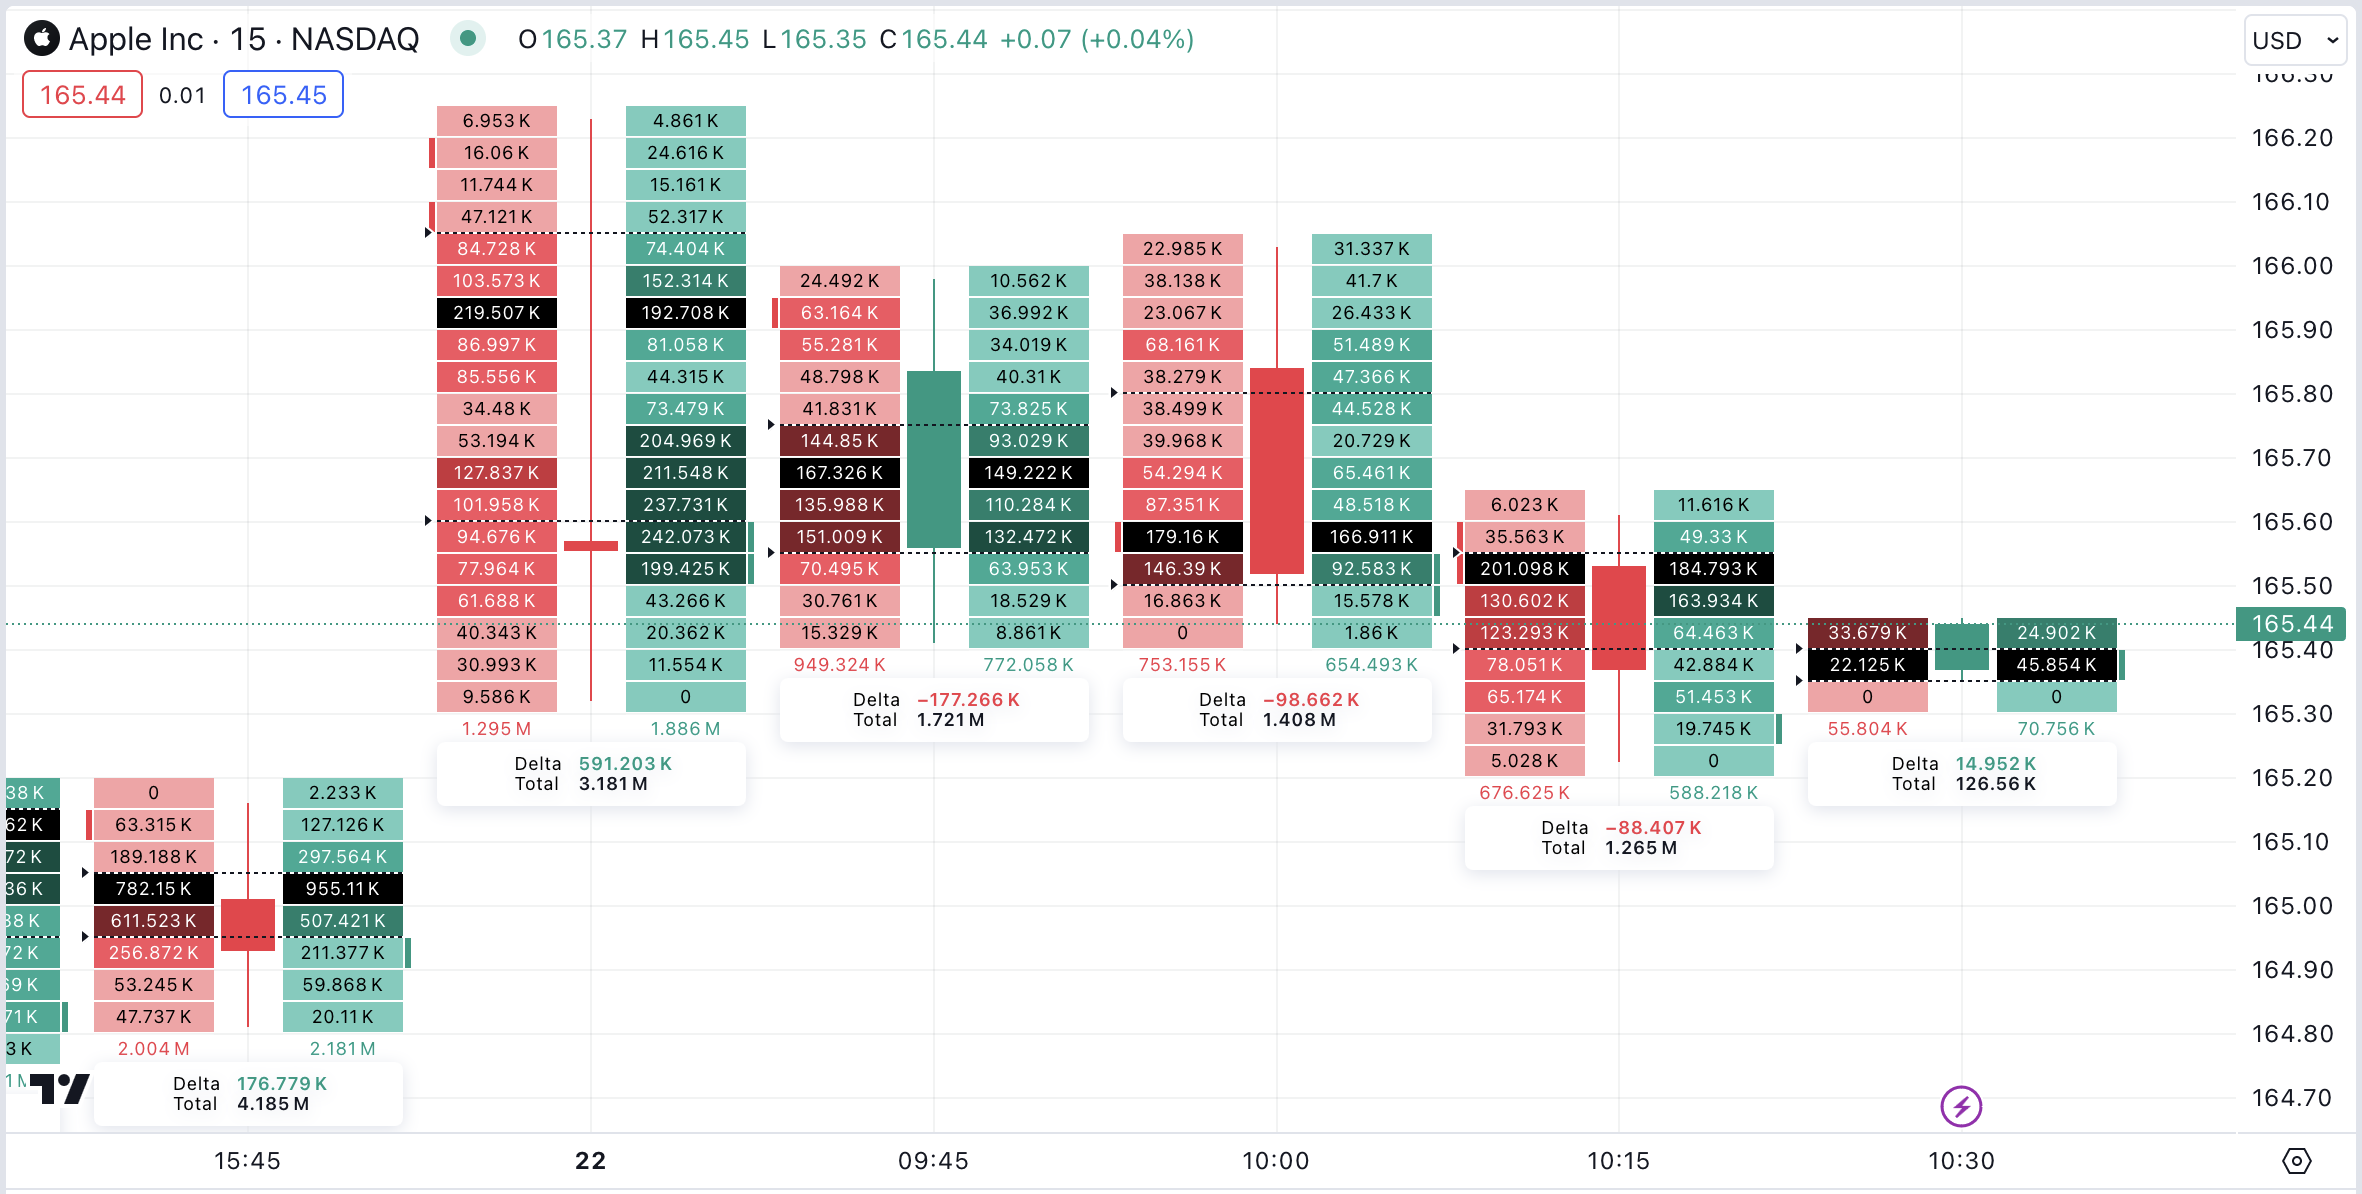
Bid/Ask Volume at Each Price Level
- The Left Number in red (Bid): Seller Volume
- The Right Number in green (Ask): Buyer Volume
- Gradient: Relative Intensity of the volume at each level
- Vertical lines: Highlight major areas of imbalance
Delta Analysis
Volume Delta (at a particular price) = Buying Volume – Selling Volume
On a TradingView footprint chart, both the volume delta and total volume are typically shown below each candlestick.
By knowing the volume differences initiated by buyers or sellers at different price levels, delta can help traders identify which side is showing more aggression. This may assist in confirming the strength or direction of an emerging price trend.
Identifying Absorption or Imbalance
Footprint charts expand on volume within a certain timeframe to help build up a demand picture of buyers and sellers. Two areas which offer analysis are absorption and imbalance.
- Absorption means prices where one side, either buying or selling, ‘absorbs’ the other side’s pressure.
- Imbalance shows lopsided amounts of buying and selling.
The footprint chart on TradingView has a feature which specifies the percentage by which buyer volume must exceed seller volume, so as to detect a significant imbalance.
Understanding either of these areas can help traders identify areas of support/resistance or a point that precedes expansion in price. For example, a level where strong buying previously occurred may attract renewed buying interest in the future.
Use Cases for Traders
Footprint charts offer traders deeper insights into market activity by showing how volume behaves at key price levels. These insights can be applied in various trading scenarios to improve decision-making, from identifying breakout strength to spotting potential reversals.
Detecting Breakout Strength
A TradingView footprint chart helps confirm the strength of breakouts by exposing whether institutional money supported the price move.
For example, a resistance level might have been repeatedly tested, forming higher lows, which is bullish. When an upside breakout occurs, the volume footprint may show huge buying pressure (positive delta). This confirmation in volume makes the breakout more reliable than just watching price action alone.
Spotting Institutional Moves
Large volumes normally associated with institutional activity can often be seen in block trades. These can be key market moves that are not always apparent through standard price charts alone.
Enhancing Entries/exits
Using a TradingView footprint chart adds another level of information for traders to use in determining their entries and exits into and out of trading positions.
Traders often combine them with traditional technical analysis to identify support/resistance levels. Understanding exactly how buyers and sellers behave at certain price points may enhance trading outcomes.
Footprint Chart vs Traditional Candlesticks
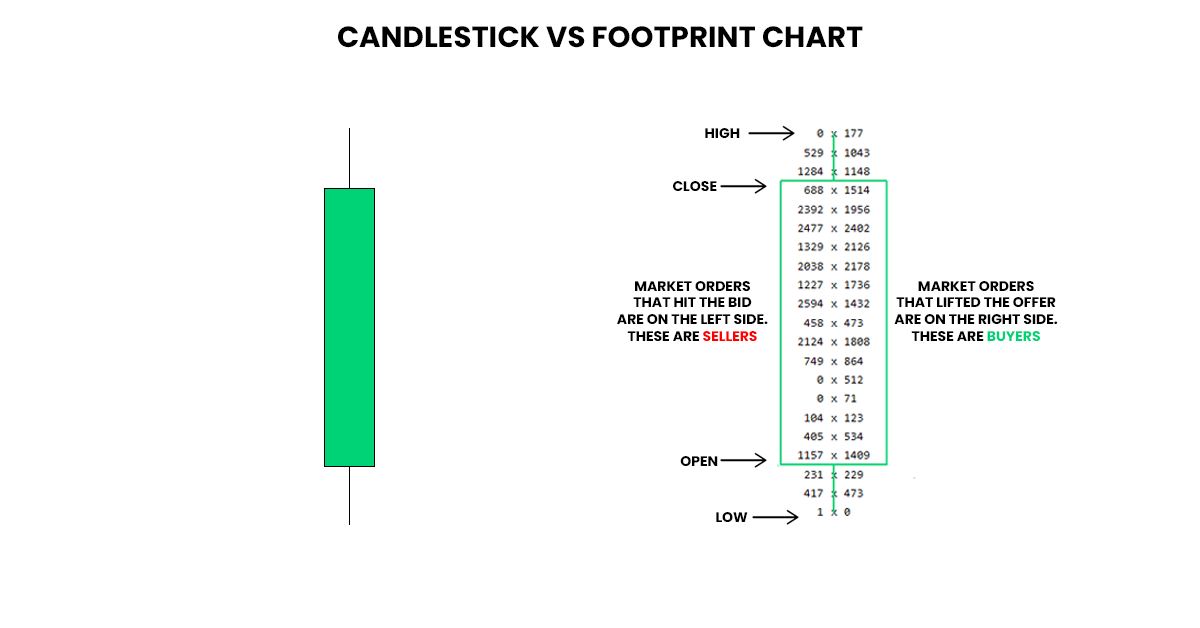
A TradingView footprint chart is essentially a more detailed form of a candlestick, giving a clearer view of the interaction between buyers and sellers. By seeing exactly how many contracts or shares were traded at each price, traders can better understand market behaviour and the internal dynamics that drive price movement.
In contrast, a traditional candlestick shows only the open, high, low, and close prices, without revealing any information about volume distribution or intrabar transactions.
When to Use Which
Standard Candlesticks: Best for identifying long-term trends and classic chart patterns across all types of assets, even those with lower liquidity.
TradingView Footprint Charts: Particularly useful in highly liquid markets where volume data is well-established. It is most powerful when combined with technical tools and price action to provide a balanced and comprehensive view of market conditions.
Understanding the Value of Footprint Charts
Understanding the value of a footprint chart on TradingView lies in its ability to reveal the “why” behind the “where.” While traditional charts show you the result of a move, this tool shows you the actual battle between buyers and sellers in real-time.
By incorporating a TradingView footprint chart into your analysis, you gain a deeper understanding of price structure and the specific behaviour of market participants in actively traded markets. Interpreting the pressure between buying and selling activity allows you to identify the true factors driving price movements—offering the context needed to gain a potential strategic advantage.
Ready to see the market in more detail? Open an account with Vantage and create a user profile on TradingView to start exploring these advanced tools in live market conditions.
RISK WARNING: CFDs are complex financial instruments and carry a high risk of losing money rapidly due to leverage. You should ensure you fully understand the risks involved and carefully consider whether you can afford to take the high risk of losing your money before trading.
Disclaimer: The information is provided for educational purposes only and doesn’t take into account your personal objectives, financial circumstances, or needs. It does not constitute investment advice. We encourage you to seek independent advice if necessary. The information has not been prepared in accordance with legal requirements designed to promote the independence of investment research. No representation or warranty is given as to the accuracy or completeness of any information contained within. This material may contain historical or past performance figures and should not be relied on. Furthermore estimates, forward-looking statements, and forecasts cannot be guaranteed. The information on this site and the products and services offered are not intended for distribution to any person in any country or jurisdiction where such distribution or use would be contrary to local law or regulation.