Large-cap and blue-chip stocks get most of the attention, but there’s another segment of the stock market that savvy investors know to keep an eye on. This is the small-cap stocks segment, which traditionally provides greater growth potential – but also greater risk and volatility compared to larger companies.
Small-cap stocks are a vital indicator of the US economy, providing valuable insights into the health of smaller, more domestically oriented businesses. Indices such as the Russell 2000 provide a comprehensive view of this segment to traders seeking a more holistic view of the US stock market.
This article explores the characteristics and features of the Russell 2000, how it compares against other popular market indices, and what investors should look out for when trading it.
Key Point
- The Russell 2000 index tracks around 2,000 small-cap US companies, offering insights into the health and growth potential of the domestic economy.
- Compared with major indices like the S&P 500, NASDAQ, and Dow Jones, the Russell 2000 provides higher growth opportunities but also greater volatility.
- Investors can gain exposure to the Russell 2000 through ETFs, futures, options, and CFDs, though its small-cap focus makes it more sensitive to economic cycles.
What is the Russell 2000 index?
The Russell 2000 index tracks around 2,000 small-cap companies listed on the US stock exchange. It was launched in 1984 by the Frank Russell Company, and is now managed by FTSE Russell [1]. Unlike other mass market indices, the Russell 2000 determines the weight of constituent stocks based on a combination of market capitalisation, as well as the stock’s inclusion in other indices.
Another unique feature of the Russell 2000 index is that it forms part of the broader Russell 3000, a US stock market index that covers nearly the entire equity market. The Russell 3000 tracks around 3,000 of the largest US-listed companies, including large-, mid-, and small-cap stocks. Together, these companies represent more than 95% of all publicly traded US stocks.
It’s important to note that the Russell 2000 tracks the smallest companies in the Russell 3000 – making it a good representative of small- and mid-cap stocks. To better suit the preferences of investors, the Russell 2000 contains two smaller sub-indices:
- The Russell 2000 Growth Index: Tracks the performance of Russell 2000 companies with higher price-to-value ratios and higher forecasted growth values.
- The Russell 2000 Value Index: Which measures the performance of Russell 2000 companies with lower price-to-book (P/B) ratios and lower forecasted growth values.
Why small-cap stocks are important for market health
Small-cap stocks belong to smaller, less-mature companies that primarily focus on serving a domestic audience, making them an important driver of growth in the US economy. Additionally, small-caps are where emerging and growing companies can be found, meaning there is greater innovation and potential for industry disruption, which may lead to notable changes in the market if the company succeeds, but also comes with higher risk.
Even if not operating in niche industries, small-cap companies provide more raw potential as they are often at earlier stages of their business life cycles, which means greater room for expansion compared to more established companies.
These factors tends to encourage investor capital flow; in this way, small-cap companies fuel business development, job creation, and economic growth, forming a steady pipeline of companies with the potential to one day grow into mid-cap and large-cap stocks, driving a critical cycle of renewal that helps prevent stagnation in the market and over concentration in a few dominant companies.
From a market perspective, small-cap stocks also serve as a barometer of investor sentiment and economic vitality.
As small-caps are generally more sensitive to shifts in consumer demand, interest rates, and economic policies, their performance can act as early signals of broader market trends. A healthy small-cap segment indicates that investors are willing to take on measured risk, reflecting confidence in future growth. But if small-caps stocks are struggling to raise funds or meet expansion plans, this could indicate flagging investor sentiment.
To sum up, small-cap stocks play a crucial role in supporting a resilient and sustainable market. While large-caps provide stability and mid-caps strike a balance between stability and growth, small-caps bring agility and the potential for higher returns. Including them in a portfolio adds another layer of diversification, providing exposure to different company sizes, which behave differently across market cycles and economic conditions.
Russell 2000 vs other major market indices
The Russell 2000 is a widely recognised benchmark for small-cap stocks in the United States. Let’s compare it with other major indices to better understand how different segments of the market behave and where the Russell 2000 fits within a broader portfolio strategy.
Russell 2000 vs S&P 500 – Small Caps vs Large Caps
| Russell 2000 (Small Caps) | S&P 500 (Large Caps) | |
| Number of Constituents | ~2,000 companies | 500 companies |
| Typical Company Size | US$300M – US$2B market cap | US$10B+ market cap |
| Sector Composition | Broadly diversified, domestic focus | Broadly diversified, global reach |
| Volatility | High – very sensitive to economic shifts | Lower – more stable earnings and cash flow |
| Growth Potential | Higher, earlier in business cycle | Moderate, incremental growth |
| Investment Role | Growth exposure and diversification | Stability and core portfolio holding |
The Russell 2000 and the S&P 500 represent two distinct ends of the market spectrum. The S&P 500 tracks 500 of the largest US companies, including global giants such as Apple, Microsoft, and Johnson & Johnson.
These companies are typically well-established, with diverse revenue streams and greater resilience during economic downturns. In contrast, the Russell 2000 consists of smaller companies that often have more limited resources and are more sensitive to economic conditions, but also offer higher growth potential due to their earlier stage in the business cycle.
While they may appear as polar opposites, both indices offer different exposures, and some investors use both to observe performance across different company size. The S&P 500 provides stability and moderate growth, while the Russell 2000 provides exposure to smaller companies, which may experience higher volatility compared with larger companies.
However, bear in mind that small-cap stocks tend to be more volatile, so the Russell 2000 will experience sharper swings during both bull and bear markets.
Russell 2000 vs NASDAQ – Growth vs Innovation
| Russell 2000 (Small Caps) | Nasdaq Composite (Tech & Innovation) | |
| Number of Constituents | ~2,000 companies | 3,000+ companies |
| Typical Company Size | US$300M – US$2B market cap | US$1B+ market cap, mostly mid- to large-cap |
| Sector Composition | Diversified across many industries | Concentrated in tech, biotech, growth tech |
| Volatility | High – cyclical and credit sensitive | High – driven by tech valuations and trends |
| Growth Potential | Organic growth from smaller businesses | Rapid growth from cutting-edge industries |
| Investment Role | Balanced exposure to small-cap sectors | Innovation-driven growth opportunities |
The NASDAQ is known for its heavy concentration of technology and innovation-driven companies, including giants like Alphabet, Tesla, and Meta. Its performance is closely tied to sentiment around high-growth sectors such as IT and biotech, leading to its status as the shorthand for the overall US tech sector.
Meanwhile, while the Russell 2000 includes some tech and biotech firms, this index is more balanced across sectors like industrials, healthcare, financial services, and consumer goods. Comparatively, the NASDAQ tends to outperform during periods of tech innovation booms, whereas the Russell 2000 might provide a more muted reaction, due to its broader exposure to the overall US small-cap economy.
Russell 2000 vs Dow Jones Industrial Average – Institutional Blue Chips vs Small Caps
| Russell 2000 (Small Caps) | Dow Jones Industrial Average (Blue Chips) | |
| Number of Constituents | ~2,000 companies | 30 companies |
| Typical Company Size | US$300M – US$2B market cap | US$50B+ market cap |
| Sector Composition | Diversified across many industries | Concentrated in large, established sectors |
| Volatility | High – sensitive to market cycles | Lower – defensive and stable earnings |
| Growth Potential | Higher, but riskier and less predictable | Lower, focused on steady performance |
| Investment Role | Aggressive growth and diversification | Defensive anchor and stability |
Tracking 30 of the largest and most established US companies, the Dow Jones Industrial Average (DJIA) has long been recognised as a symbol of corporate strength and industrial maturity.
Given that it is made up of blue chip companies that typically have stable earnings, global operations and strong balance sheets, DJIA tends to be less volatile. The index is widely followed by institutional investors, acting as a direct channel to what may be considered the bedrock of the US economy.
The Russell 2000, by contrast, tracks thousands of smaller companies with higher potential for growth but also higher volatility and greater risk. While DJIA is seen as a measure of the health of established corporations, the Russell 2000 often acts as a leading indicator of shifts in risk appetite and domestic economic conditions.
With its constituents being highly sensitive to economic factors such as interest-rate announcements, availability of credit and changes in consumer demand, the Russell 2000 may reflect trends in economic cycles and shifts in investor, though past behavior does not guarantee future outcomes. This makes the Russell 2000 valuable for analysts and investors who want to gauge the market’s forward-looking outlook.
How the Russell 2000 Index is Calculated
Like the majority of market indices, the Russell 2000 is calculated using a market-cap weighting method. This means that constituent stocks have weightage proportional to their market capitalisation (share price multiplied by number of outstanding shares).
However, the unique thing about the Russell 2000 is that it tracks the smallest 2,000 (or so) small-cap companies listed in US stock exchanges. Also, to be included in the Russell 2000, a company must first be included in the broader Russell 3000 index.
Notable Sectors in the Russell 2000
As of Aug 31 2025, the Russell 2000 is comprised of the following 11 sectors:
| Sector | Index weightage (%) |
| Industrials | 19.00 |
| Healthcare | 15.15 |
| Financials | 14.84 |
| Technology | 13.92 |
| Consumer Discretionary | 13.09 |
| Energy | 7.81 |
| Real Estate | 5.79 |
| Basic Materials | 3.91 |
| Consumer Staples | 2.68 |
| Utilities | 2.64 |
| Telecommunications | 1.17 |
What can we glean from this? Firstly, the Russell 2000 is quite well-balanced with core economic segments well-represented: with Industrials (18.91%), Financials (18.44%), Healthcare (15.4%) and Consumer Discretionary (12.22%) making up nearly 65% of the index. This makes the Russell 2000 more representative of economic health markers (at least through the lens of small-cap companies) in terms of domestic demand, capital-expenditure cycles, labour costs, and credit availability.
Furthermore, the Russell 2000 is likely highly sensitive to interest rate changes. This is because Financials (18.44%), Real Estate (6.39%) and Utilities (3.65%) account for approximately ~28.5% of the index, meaning shifts in the interest rates, and changes in the landing landscape can move small-caps quickly. In brief, the Russell 2000 is sensitive to changes in interest rates and credit availability, which may affect the performance of its constituent companies.
Finally, the Russell 2000 index is unlikely to be strongly affected by dislocations in commodity markets, given that Energy (5.05%) and Basic Materials (3.68%) add up to just 8.73% of the index. However, the faint presence of Consumer Staples (2.01%) and Utilities (3.65%) leaves the index lacking a defensive buffer.
How Often is the Russell 2000 Rebalanced?
The Russell 2000 is rebalanced once a year, where companies are added or removed based on their market cap. This widely-watched event is known as the Russell Reconstitution, and takes place in June every year.
The Russell Reconstitution is essential to reflect changes in the market capitalisation and structure of publicly traded US companies. Inclusion in the index often brings increased market visibility for the company, encouraging institutional ownership. Conversely, deletion from the index can result in reduced visibility and potentially lower demand for a company’s shares.
For this reason, the reconstitution becomes a highly anticipated moment for traders, fund managers and companies, as it can have profound implications for stock liquidity, visibility and performance.
In a move expected to ease the heightened volatility around reconstitution, FTSE Russell will transition to a semi-annual reconstitution schedule starting in 2026. Instead of one major reshuffle in June, the indexes will now be updated twice a year in June and December. [2]
Historical Performance of the Russell 2000
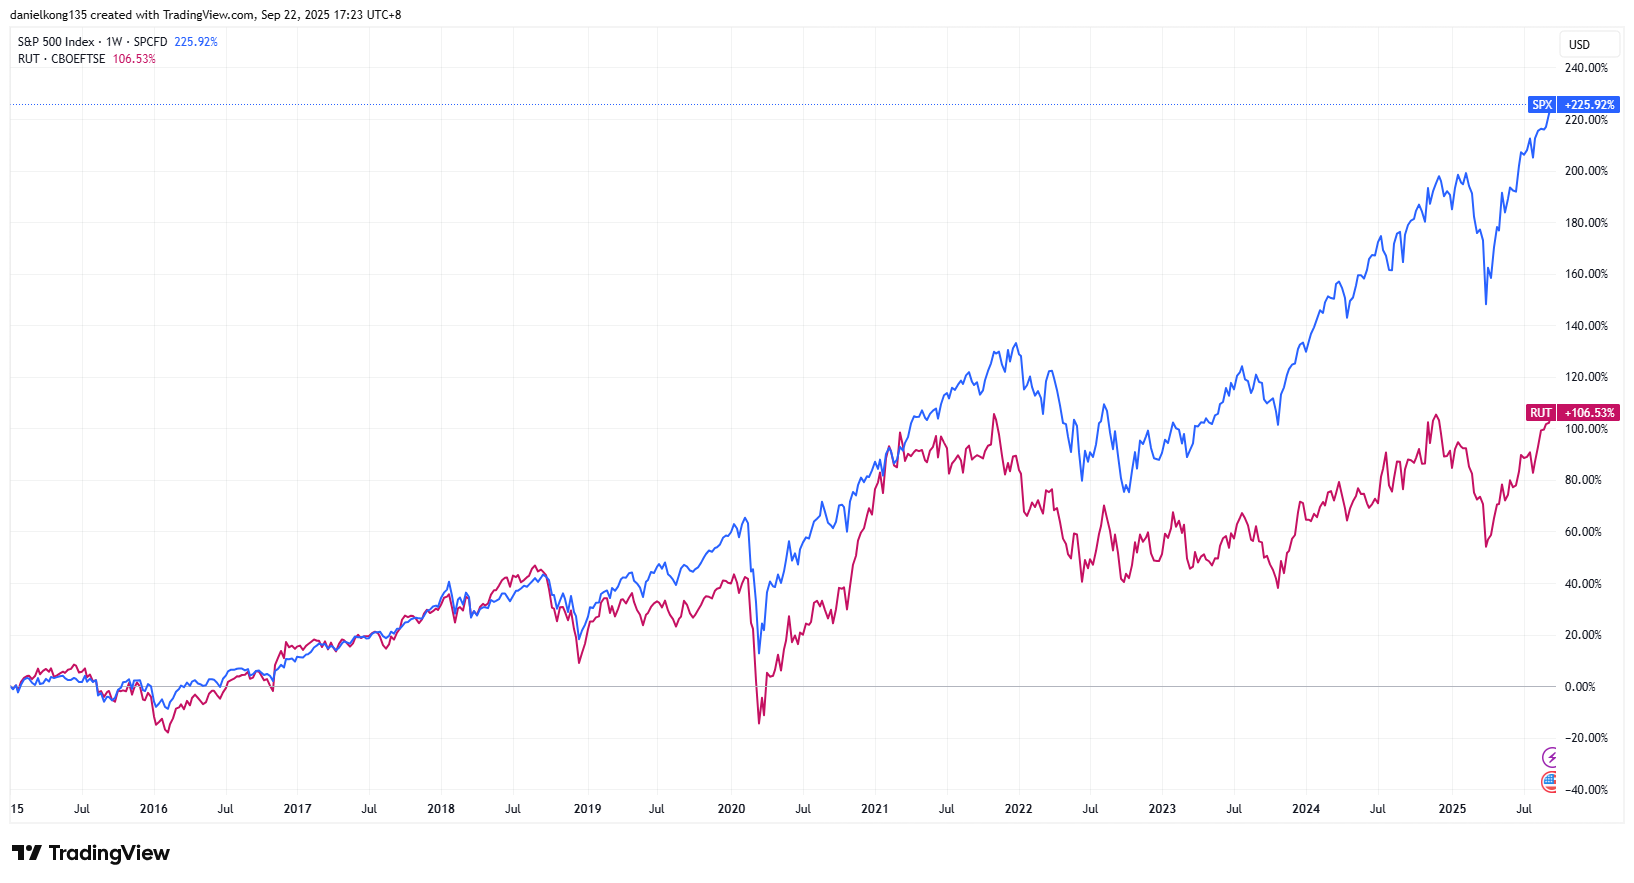
The chart above shows the historical performance of the Russell 2000 (in blue), ranging from 2006 to Sep 2025. To compare the performance of small-cap US stocks against that of the broader US stock market, we’ve added the S&P 500 (in red).
As shown, during the early 2000’s the Russell 2000 has largely mimicked the performance of the S&P 500, meaning investors did not get outsized returns for taking on increased risk. Investor patience was rewarded, however, when small-cap stocks outperformed the broader market between 2011 and 2016.
This rally proved short-lived, with the small-cap index falling back into lockstep with the S&P 500 until around 2019. From this point on, the Russell 2000 failed to keep up with the broader market – both indices diverged significantly, with small-cap stocks suffering a larger drop at the height of the pandemic.
This makes sense considering that younger, less established companies had lower resilience to withstand lockdowns, while climbing inflation forced interest rates up – and credit out of the hands of smaller businesses.
Since then, the Russell 2000 has continued to underperform the overall stock market. The market bounceback after the pandemic is particularly telling; even though both indices experienced a bull run, it was the S&P 500 that outgrew small-caps. This, perhaps, indicates lingering fear in the markets, with investors preferring to remain with large, more established companies for now.
Another notable feature is how the Russell 2000 mimics the broader market during downturns, with the small-cap index having declines that coincide with those of the S&P 500. This is to be expected, given how small-cap stocks are seen as riskier plays, and would be prime candidates for sell-offs during a market downturn.
However, we also tend to see that Russell 2000 has an altogether more jagged curve due to larger price spikes. In some areas, price increases are also more pronounced, demonstrating the tendency of small-cap stocks to display higher volatility compared to the broader market.
How to Trade or Invest in the Russell 2000
As the Russell 2000 is simply a market benchmark and has no real assets attached to it, direct investment is not possible. Investors and traders wishing to gain exposure to the price action of the small-cap index can do so indirectly, either with derivatives or investment funds set up to track the index.
ETFs and Index Funds
ETFs and index funds are financial instruments that pool investors’ monies together for the purpose of investing in market securities. Some of these funds are set up to track the performance of the Russell 2000 index, allowing you to gain exposure to the performance of small-cap US stocks.
Russell 2000-tracking ETFs and index funds run automatically, and do not require balancing or active intervention from fund managers. As such, they are relatively cheap to own, with an expense ratio typically ranging between 0.25% p.a. – 0.35% p.a. (this covers the management fees).
Some popular funds that track the Russell 2000 include:
- iShares Russell 2000 ETF (IWM)
- Vanguard Russell 2000 ETF (VTWO)
- Avantis US Small Cap Equity ETF (AVSC)
- SPDR Russell 2000 US Small Cap UCITS ETF (ZPRR)
- Xtrackers Russell 2000 UCITS ETF 1C (XRS2)
Note that these funds are mostly suited for a long-term buy-and-hold strategy, leveraging on natural market cycles to derive capital appreciation. Results can vary depending on market conditions, and investors should be aware of the time horizon required to observe market trends
Contracts-for-Difference (CFDs)
Contracts-for-Difference (CFDs) are an agreement between two parties to exchange the difference in price of an underlying asset or security. For the Russell 2000 index, CFDs offer a convenient way to speculate on the price action of small-cap US companies without direct ownership of funds, or having to buy or sell options.
CFDs can be traded on leverage, which means you can control a larger position with a smaller upfront capital, or spread your trading budget across several positions at once. This allows greater capital efficiency.
Furthermore, CFDs offer greater flexibility as you can choose to go long (buy) or short (sell), depending on your read of which way the index is headed. This means traders can take positions on the Russell 2000 via derivatives such as CFDs, which carry significant risk and may result in losses as well as gains.
Additionally, unlike options and futures, CFDs do not have time limitations, which means you can hold a position for as long as is needed for your strategy to bear out. In doing so, though, it is important to mind overnight holding costs and other fees.
Equally important is the awareness of the possibility of margin calls. As CFDs are leveraged products, if the market goes against your position in the course of the trade, your broker will request additional collateral to cover the potential loss. This will result in a margin call, and failing to meet it will cause your trade to be closed immediately, and losses assigned to your account.
And let’s not forget that while leverage amplifies your profits, it also does the same to your losses. Hence, it is important to practice proper risk management when trading CFDs by
- Making proper use of stop losses and take profits to limit losses and lock in profits
- Setting appropriate position sizes, so you don’t get wiped out in a few bad trades
- Controlling use of leverage, to ensure your ability to meet margin calls
Remember that the Russell 2000 is inherently more volatile, and should be approached with due discipline and caution.
Advantages and Risks of Russell 2000 Investing
The Russell 2000 adds meaningful diversification by giving you exposure to company size as a return driver, not just sectors or geographies. Its constituents are earlier in their business lifecycles, so the index offers higher growth potential than large-cap benchmarks when the economy is expanding and credit is flowing.
Crucially, it provides direct exposure to US small caps, which are more tied to domestic demand, wages, and lending conditions. As such, this index may provide insights into the behavior of smaller US companies relative to the broader market, but does not guarantee performance or returns.
On the flipside, the small-cap nature of the Russell 2000 brings greater volatility and higher sensitivity to economic cycles. Earnings are less predictable, company profitability can compress quickly when rates rise or costs bite, and there is greater reliance on access to financing.
In trading, liquidity can also be thinner during market stress, which means drawdowns can be sharper and recoveries more uneven. Position sizing, time-horizons, and rebalancing discipline matter.
Tap Into the Potential of Small-cap US Stocks with the Russell 2000
The Russell 2000 is a useful market barometer that can provide useful early signals before they are picked up in the broader market. This is because when risk appetite and domestic growth are improving, small caps often lead; when conditions tighten, they tend to lag.
For long-term investors, the Russell 2000 may provide additional diversification compared to large caps, and small caps can react differently to market conditions.
Interested in learning more about the Russell 2000 index and how to better leverage the potential of small-cap US companies? Browse our Vantage Academy for webinars, articles and guides on CFDs and trading, or brush up on the basics in our Indices Beginners Course. Ready to jump in? Sign up for an account with Vantage today!
References:
- “Russell 2000 Index Definition and Key Metrics – Investopedia”. https://www.investopedia.com/terms/r/russell2000.asp . Accessed 22 Sept 2025.
- “Russell 2000 Index – LESG”. https://research.ftserussell.com/Analytics/FactSheets/Home/DownloadSingleIssue?issueName=US2000USD&isManual=True . Accessed 22 Sept 2025.