[DAILY TRADING] Nikkei 225 Analysis 2 July 2026 – Index Slides to 68,355 as Chip Stocks Lead Broad Selloff
Vantage Editorial Team >
Vantage Editorial Team >
Vantage is a global, multi-asset broker with a team of in-house writers and market analysts who produce educational and insightful trading content for traders of all levels.
![[DAILY TRADING] Nikkei 225 Analysis 2 July 2026 – Index Slides to 68,355 as Chip Stocks Lead Broad Selloff](https://www.vantage-markets-apac.com/wp-content/uploads/2026/06/Nikkei225_Hero_29May2026.webp)
The Nikkei 225 index, also widely searched as Nikkei225, traded near 68,355 on the Vantage Japan Index Cash CFD as of 15:22 (GMT+8) on 2 July 2026, well off last week’s push above 70,000.[1] Checking the Nikkei index today shows a broader technology-led selloff that swept across Wall Street overnight and carried into Asian trading on Thursday, with chip and AI-related names leading the declines.[2] This piece reads the Nikkei 225 chart from the Vantage platform alongside today’s session drivers.
All levels and figures below are indicative and for informational purposes only, current as of the cutoff time stated above.
Nikkei 225 chart: what today’s session is showing
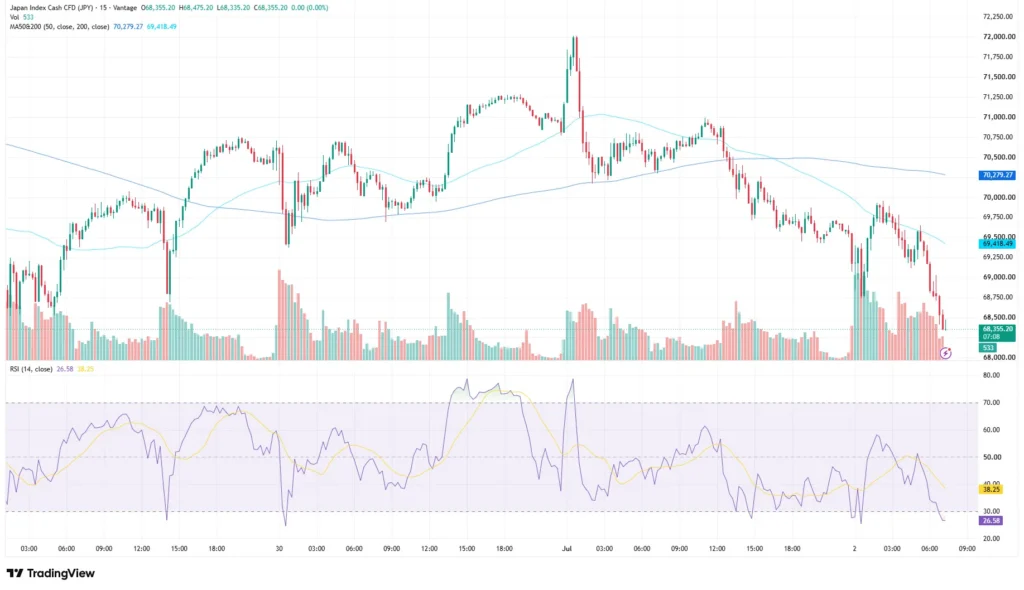
On the 15-minute Nikkei 225 chart from Vantage, the Japan Index Cash CFD opened the session at 68,355.20 and traded in a narrow band between a session high of 68,475.20 and a session low of 68,335.20 as of the cutoff, with the last print sitting at 68,355.20. That range sits well below both moving averages plotted on the chart. The 50-period moving average currently reads 70,279.27, while the 200-period moving average sits lower at 69,418.49. Price trading beneath both lines points to an index that has lost short-term momentum after last week’s advance toward the 72,000 area.
The RSI, based on the TradingView setup used for this analysis, printed 26.58, with its moving-average overlay at 38.25. A reading in the mid-20s sits inside oversold territory on the 14-period setting, and the gap between the RSI line and its overlay reflects how quickly momentum has faded over the past few sessions. Volume on the chart picked up noticeably during the sharpest legs of the decline, consistent with broad participation across the market rather than isolated selling.
Discover all latest Nikkei225 news here.
Why the Nikkei 225 stock index fell today

The immediate driver behind today’s move in the Nikkei 225 stock index was the tech-led selloff that hit Wall Street on Wednesday and carried through Asian markets on Thursday. US chip names came under pressure, with Micron Technology falling more than 10% despite a roughly 260% year-to-date gain and Sandisk shedding a similar amount, while Nvidia and Broadcom slipped between 1% and 2%.[2]
That pressure carried directly into Japan’s chip and AI-related shares. Kioxia Holdings dropped 11.4%, Taiyo Yuden fell 4.3%, Tokyo Electron declined 6.2%, Advantest lost 6.7%, and Fujikura slid 6.6%.[1]
Not every part of the Nikkei stock market index moved the same way. Financial and consumer names mostly advanced, with Mitsubishi UFJ up 1.9%, Mizuho Financial up 2.4%, and Toyota Motor gaining 3.6%, a split that points to sector rotation rather than a market-wide flight from Japanese equities.[1]
The move also spread across the region. South Korea’s Kospi also came under pressure, with semiconductor shares including Samsung Electronics and SK Hynix posting sharp losses.[3] Against that backdrop, developments in the Middle East conflict offered little offset. Increased oil flows through the Strait of Hormuz and signs of progress in indirect US-Iran talks did little to steady sentiment once the chip-led selling took hold.[1]
A comment from Federal Reserve Chair Kevin Warsh that inflation expectations had eased over the past month, reducing expectations for additional near-term policy tightening, was also largely overshadowed by the technology rotation.[1]
Levels to watch
| Level | Role |
| 68,335 | Session low on the Vantage Japan Index Cash CFD chart; the closest support currently in play as of the cutoff. |
| 69,418 | 200-period moving average on the chart; now sits above price and is the first resistance level to watch. |
| 70,279 | 50-period moving average on the chart; secondary resistance above the 200-period line. |
| 72,250 | Recent swing high visible on the chart around 1 July; marks the top of the current range. |
Table 1: Key levels as of 15:22 (GMT+8) on 2 July 2026, based on the Vantage Japan Index Cash CFD chart used for this analysis. Levels are indicative only.
What to watch next
Traders following the Nikkei stock exchange index into Friday’s session should keep an eye on the following.
- US Non-Farm Payrolls, 3 July 2026: The next major US data print traders are watching for signs of labour market resilience, which could feed into sentiment across the Nikkei 225 index into Friday’s session.
- Chip Sector Earnings Commentary: Any further guidance from major semiconductor names could set the tone for whether today’s rotation out of AI-related shares in Japan continues or steadies.
- Bank of Japan Policy Signals: Traders continue to watch for any comment from Bank of Japan officials given the yen’s recent weakness and past discussion of intervention.
- Middle East Conflict Developments: Any shift in the tone of indirect US-Iran talks remains a factor for broader risk sentiment across Asian equity markets.
Market participants often monitor these technical levels closely during periods of elevated volatility, as price can move rapidly through nearby support and resistance zones. This is the kind of session where traders may pay closer attention to risk management and overall exposure, as correlated technology-related positions can move sharply together during periods of heightened volatility.
Leverage is a double-edged tool that can magnify both gains and losses, and it is worth revisiting position sizing relative to account equity ahead of Friday’s Non-Farm Payrolls release, particularly for exposure to the Nikkei 225 index and related Japanese equity CFDs. Traders can view live pricing on the Vantage JP225 index CFD page. Background on the technical setup referenced above is available on the RSI academy page and the leverage in trading academy page.

RISK WARNING: CFDs are complex financial instruments and carry a high risk of losing money rapidly due to leverage. You should ensure you fully understand the risks involved and carefully consider whether you can afford to take the high risk of losing your money before trading.
Disclaimer: The information is provided for educational purposes only and doesn’t take into account your personal objectives, financial circumstances, or needs. It does not constitute investment advice. We encourage you to seek independent advice if necessary. The information has not been prepared in accordance with legal requirements designed to promote the independence of investment research. No representation or warranty is given as to the accuracy or completeness of any information contained within. This material may contain historical or past performance figures and should not be relied on. Furthermore estimates, forward-looking statements, and forecasts cannot be guaranteed. The information on this site and the products and services offered are not intended for distribution to any person in any country or jurisdiction where such distribution or use would be contrary to local law or regulation.
References
[1] “Japan Stock Market Index (JP225)” – Trading Economics https://tradingeconomics.com/japan/stock-market Accessed on 2 July 2026.
[2] “Stock futures edge up after weak start to July trading; jobs report ahead: Live updates” – CNBC https://www.cnbc.com/2026/07/01/stock-market-today-live-updates.html Accessed on 2 July 2026.
[3] “South Korea Stock Market” – Trading Economics https://tradingeconomics.com/south-korea/stock-market Accessed on 2 July 2026.
