


[DAILY TRADING] USDX Analysis 15 July 2026 – Dollar Index Holds Near 100.60 as CPI Cools, Fed Signals Inflation Fight Isn’t Over

Vantage Editorial Team >
Vantage Editorial Team >
Vantage is a global, multi-asset broker with a team of in-house writers and market analysts who produce educational and insightful trading content for traders of all levels.
 Updated Wed, 2026 July 15 02:38
![[DAILY TRADING] USDX Analysis 15 July 2026 – Dollar Index Holds Near 100.60 as CPI Cools, Fed Signals Inflation Fight Isn’t Over](https://www.vantage-markets-apac.com/wp-content/uploads/2026/06/usdx_hero-1.webp)
The US Dollar Index (USDX), also known as the U.S. Dollar Index, USD Index, or DXY, traded at 100.608 as of 09:47 (GMT+8) / 01:47 UTC on 15 July 2026, ranging between 100.606 and 100.621 on the Vantage US Dollar Index CFD chart.[1] That leaves price below its 50-period moving average at 100.835 and just below its 200-period moving average at 100.664.[1] The move follows a volatile 48 hours in which cooler US inflation data met a Fed testimony in which Chair Kevin Warsh signalled the inflation fight isn’t over, while the Middle East conflict kept a floor under the dollar’s safe-haven bid.[2][3]
What’s Moving the Dollar Index Today

As the market’s primary USD currency index, USDX reacted first to inflation data, then to Fed commentary. June’s Consumer Price Index, released 14 July 2026, cooled to 3.5% year on year from 4.2% in May, with prices down 0.4% on the month, the largest monthly drop since 2020.[2] Core CPI was unchanged month-over-month and slowed to 2.6% year-over-year.[2] The index eased on the print before recovering part of that move.[4]
Fed Chair Kevin Warsh testified before both the House Financial Services Committee and the Senate Banking Committee this week, his first semi-annual testimony to Congress since taking office in May.[3][7] Warsh said one encouraging inflation reading does not mean the Fed’s work is finished, and that the 2% target remains the benchmark.[3][5]
Markets still expected the Federal Reserve to keep policy restrictive, although expectations for further tightening eased after the softer inflation report.[2][4] Renewed Middle East tension, including fresh US action against Iran and shifting reports on shipping conditions in the Strait of Hormuz, kept a floor under the dollar’s safe-haven bid.[4][6]
Reading the USDX Chart
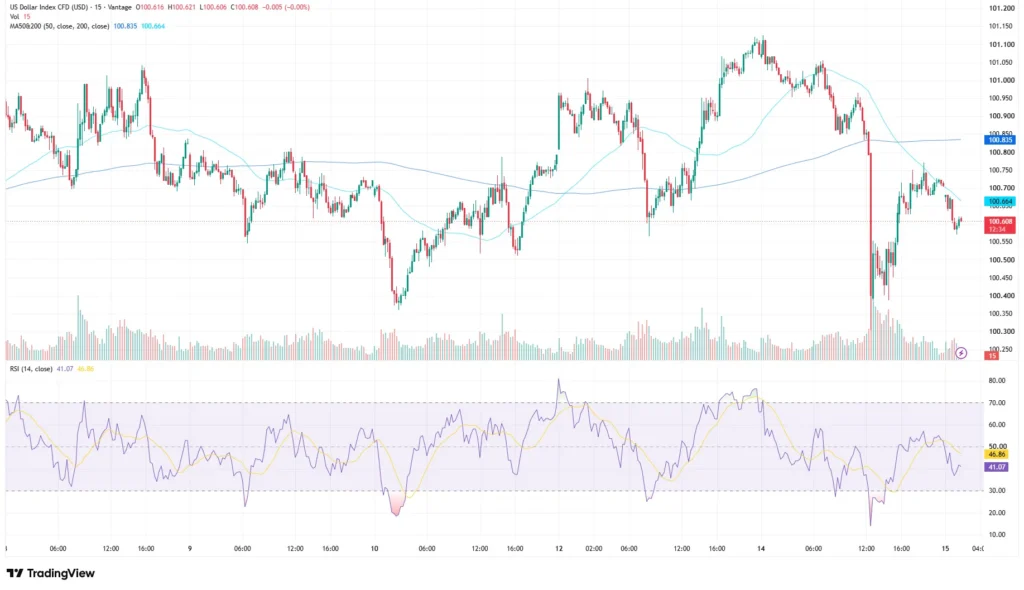
Across major charting platforms, the picture remains one of consolidation rather than a sustained trend. The index opened near 100.60 on 8 July 2026, eased toward 100.35 by 10 July, then rallied above 101.15 on 12 July.[1] The index extended its rally toward 101.10 ahead of the 14 July CPI release, before reversing sharply once the inflation data were published, pulling back toward 100.25 to 100.30 within the same session.[1][2] The index then recovered part of that move to around 100.65 to 100.70, before easing again toward the current 100.608 level.[1]
That leaves price below the 50-period moving average at 100.835 and below the 200-period moving average at 100.664, suggesting resistance is still holding at these levels.[1] A sustained close above the MA200 would provide stronger confirmation that downside momentum is fading.
The Relative Strength Index reads 41.07, with its moving-average overlay at 46.86, the TradingView setup used for this analysis shows.[1] Both sit below the 50 midline but above the 30 oversold threshold, consistent with softening rather than oversold momentum. The RSI fell toward 20 during the CPI-driven decline before recovering with price.[1]
Levels Traders Are Watching
The table below sets out the reference zones traders are watching on the US Dollar Index chart today. These are structural levels, not trade signals.
| Level Type | Price | What’s Happening |
| Resistance | 101.05 – 101.15 | Swing highs from 12 and 14 July |
| Pivot (50-period MA) | 100.835 | Lost during the CPI-driven decline on 14 July |
| Pivot (200-period MA) | 100.664 | Price consolidating just below this average |
| Support | 100.25 – 100.30 | Lows from 10 and 14 July |
Table 1: Key levels as of 09:47 (GMT+8), 15 July 2026. Sources: TradingView, Vantage US Dollar Index CFD chart. Indicative only.
A close back above 100.835 would put the index back inside last week’s range. A move below 100.25 to 100.30 would mark a break of the week’s low.

What to Watch This Week
Here is what could move the US Dollar Index over the next few sessions, per the Vantage economic calendar:
- FOMC meeting, 28 to 29 July 2026: The Fed’s next scheduled decision, with a press conference the same afternoon.[7]
- Strait of Hormuz developments, Ongoing: Easing reports would tend to remove safe-haven support from the dollar; further disruption would tend to add to it.[4][6][8]
Traders holding positions across the dollar index, gold, and other USD pairs often review combined exposure in weeks with this much event risk, since a Fed or Middle East shift can move several markets at once. Many traders monitor the 100.25 to 100.30 support zone and 100.835 to 101.05 resistance area when assessing risk, though Stop Loss placement depends on individual strategy.
Leverage remains a double-edged tool in a week this dense with data and geopolitical headlines. It can magnify gains as easily as losses, and position sizing relative to account equity is worth revisiting ahead of the next FOMC decision. See last week’s USDX chart update for the broader trend.

RISK WARNING: CFDs are complex financial instruments and carry a high risk of losing money rapidly due to leverage. You should ensure you fully understand the risks involved and carefully consider whether you can afford to take the high risk of losing your money before trading.
Disclaimer: The information is provided for educational purposes only and doesn’t take into account your personal objectives, financial circumstances, or needs. It does not constitute investment advice. We encourage you to seek independent advice if necessary. The information has not been prepared in accordance with legal requirements designed to promote the independence of investment research. No representation or warranty is given as to the accuracy or completeness of any information contained within. This material may contain historical or past performance figures and should not be relied on. Furthermore estimates, forward-looking statements, and forecasts cannot be guaranteed. The information on this site and the products and services offered are not intended for distribution to any person in any country or jurisdiction where such distribution or use would be contrary to local law or regulation.
References
[1] Vantage US Dollar Index CFD (USDX) 15-minute chart, TradingView. Accessed 09:47 (GMT+8) on 15 July 2026.
[2] “Consumer price index inflation report June 2026 – CNBC” https://www.cnbc.com/2026/07/14/consumer-price-index-inflation-report-june-2026.html Accessed on 15 July 2026.
[3] “CPI inflation, Kevin Warsh Capitol Hill testimony – CNN” https://www.cnn.com/2026/07/14/business/live-news/cpi-inflation-kevin-warsh-capitol-hill-testimony Accessed on 15 July 2026.
[4] “United States Dollar – Quote – Chart – Historical Data – News – Trading Economics” https://tradingeconomics.com/united-states/currency Accessed on 15 July 2026.
[5] “Fed Chair Kevin Warsh Testifies on Inflation Commitment Amid June CPI Drop – IndexBox” https://www.indexbox.io/blog/chairman-warsh-vows-to-curb-inflation-as-june-cpi-shows-price-decline/ Accessed on 15 July 2026.
[6] “Stock market news for July 14, 2026 – CNBC” https://www.cnbc.com/2026/07/13/stock-market-today-live-updates.html Accessed on 15 July 2026.
[7] “Federal Reserve Board – Calendar: July 2026” https://www.federalreserve.gov/newsevents/2026-july.htm Accessed on 15 July 2026.
[8] “Stock Market Today (July 14, 2026) – TheStreet” https://www.thestreet.com/stock-market-today/stock-market-today-dow-jones-sp-500-nasdaq-updates-july-14-2026 Accessed on 15 July 2026.