Markets are often described as either bullish or bearish – two terms that capture the overall direction of prices and investor sentiment. Simply put, a bullish market is one where prices are rising and confidence is high, while a bearish market is one where prices are falling and pessimism dominates.
Understanding both terms is essential for anyone involved in trading or investing. Recognising whether the market is in a bullish or bearish phase can help traders make more informed decisions, manage risk better, and understand the psychology driving price movements.
In this article, we will explore the commonly used definitions of bullish and bearish markets, real-world examples and key indicators of each market state, and the implications on your trading strategy.
Key Points
- A bullish market reflects rising prices, optimism, and strong economic data, while a bearish market shows falling prices, fear, and weaker fundamentals.
- Traders use technical, fundamental, and sentiment indicators to identify whether market conditions are bullish or bearish.
- Understanding both market phases helps traders recognise opportunities, manage risks, and adjust strategies across changing economic cycles.
What Does Bullish Mean?
A bullish market is one where prices chart an upwards trend over time, translating to capital gains. Like a charging bull, stock prices seem unstoppable, pushing forward powerfully
During bull markets, investors tend to be optimistic, as growing asset prices inflate their portfolio values. There is a prevailing belief that the economy and corporate earnings will continue to grow, increasing investor confidence. This confidence further fuels demand for stocks and shares as more investors enter the market, pushing prices even higher.
Bullish markets can be identified by these four key characteristics:
- Rising asset prices and sustained upward momentum
- Strong investor confidence and optimism
- Higher trading volumes as more participants enter the market
- Economic expansion, reflected in positive data such as GDP growth and employment gains
Technical Indicators of Bullish Sentiment
On the charts, a bullish market is often accompanied by clear technical patterns that point to upward momentum and strengthening investor confidence. Traders rely on these signals to confirm that buying pressure is outpacing selling pressure.
1. Higher highs and higher lows
One of the clearest technical signs of a bullish trend is a price chart that consistently makes higher highs and higher lows. This pattern shows that buyers are willing to pay increasingly higher prices, and sellers are closing trades at higher lows, both strong signals of positive momentum.
2. Moving averages trending upward
Moving averages (MAs) are technical indicators that smooth out price data over a specified time range, dampening market noise to more clearly indicate price trends.
When the market is in a bullish phase:
- The short-term moving averages (such as the 50-day MA) typically rise above the long-term averages (such as the 200-day MA).
- This crossover, known as a golden cross, is a classic technical confirmation of a sustained uptrend.
- The slope of both moving averages tilting upward also reinforces bullish momentum.
3. Trading volume builds as prices rise
Volume tells traders how much conviction lies behind a price move. In a healthy bull market, rising prices are usually accompanied by increasing trading volume, which suggests strong participation from investors. When prices rise on low volume, it may indicate a weaker or short-lived rally.
4. Relative Strength Index (RSI) above mid-range
The RSI, a momentum oscillator that ranges from 0 to 100, often stays in the 60–80 range during a bullish market. This shows that buying momentum is dominant but not yet at an extreme. A sustained RSI above 50 is generally viewed as confirmation of bullish sentiment.
5. Positive MACD crossover
The Moving Average Convergence Divergence (MACD) indicator measures the difference between short-term and long-term momentum.
When the MACD line crosses above its signal line, it often signals the start of a bullish phase. A rising histogram and MACD values above zero further confirm strengthening upward momentum.
6. Breakouts above resistance
In bullish conditions, prices often break through key resistance levels – price points that previously capped upward movement. In the process, prices establish higher highs, a key characteristic of bullish markets.
When confirmed, a breakout to higher prices – especially on strong volume – can trigger further buying, signalling newer highs are likely ahead.
Together, these technical indicators help traders identify and confirm the strength of a bullish market trend. While no single signal guarantees continued gains, observing several of these patterns together often suggests that market sentiment is positive and that the upward move has strong momentum behind it, indicating that the rally is likely to last.
A Recent Example of a Bullish Market
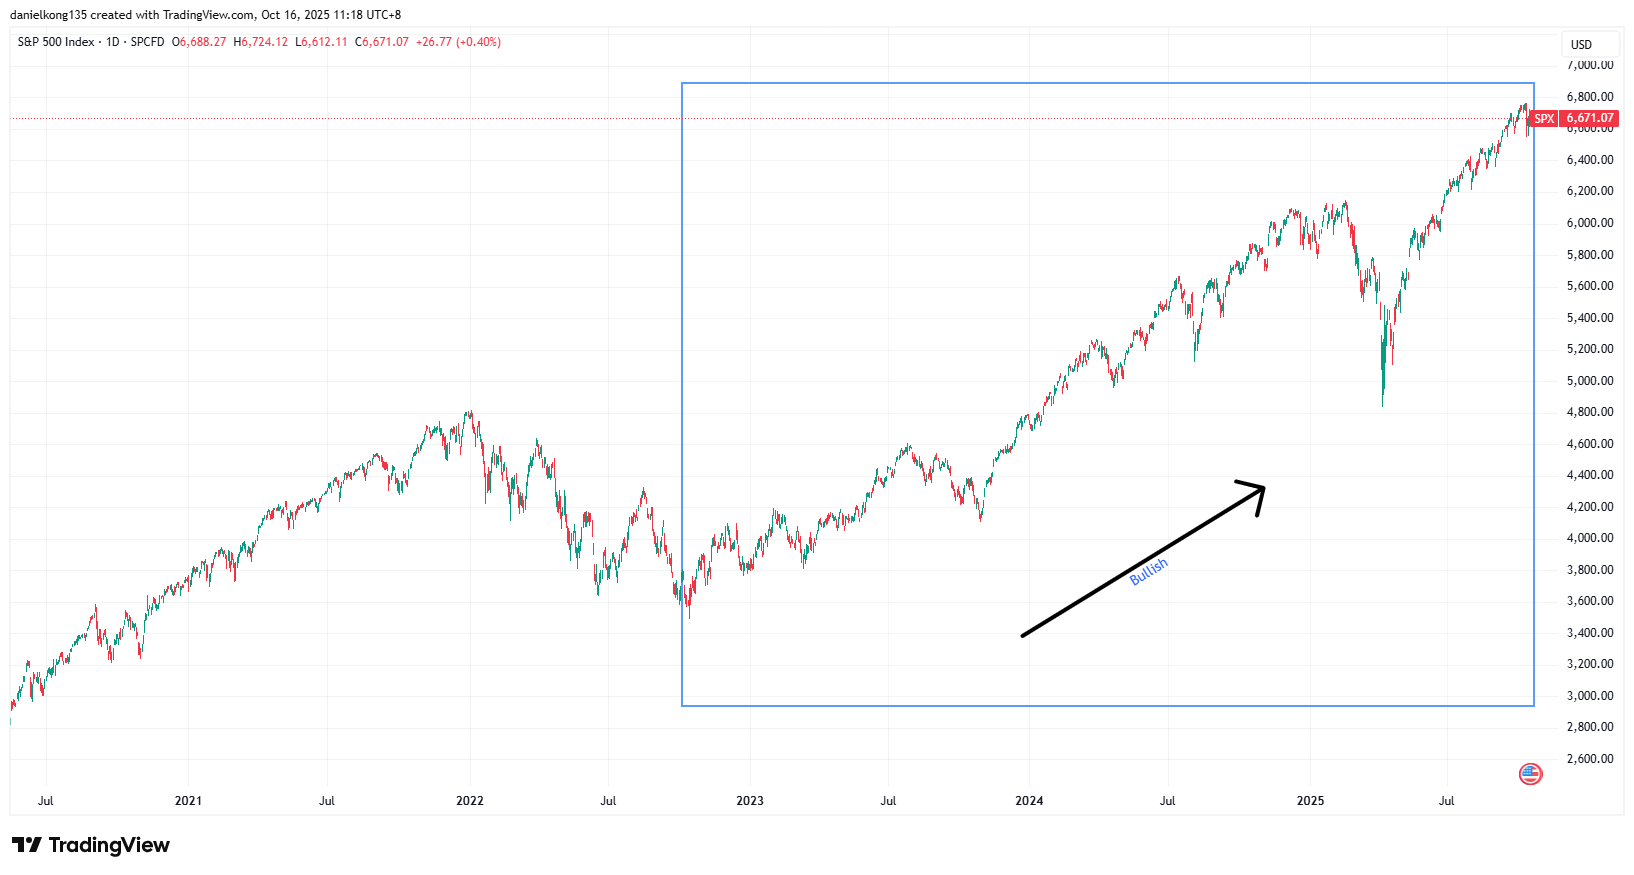
The most recent significant bull run in the US stock market began in late 2022 and continued through 2024. Fueled by optimism around artificial intelligence (AI) and expectations of Federal Reserve interest rate cuts, the S&P 500 climbed to record highs. Tech giants such as Nvidia, Microsoft, and Amazon led this rally, marking one of the strongest bull runs since the post-pandemic recovery.
As can be seen in the screenshot above, the SPY (an ETF which tracks the S&P 500), charted a strong upward trend throughout the period, with the index rising by a staggering 80%.
Typical of any bull rally, there were price dips that took place along the way, with at least one significant price plunge in April 2025, which was driven mainly by tariff announcements from Trump’s office. However, bullish sentiment soon returned, pushing prices to higher highs as the bull run continued.
What Does Bearish Mean?
If a bullish market is one of rising prices and increasing optimism, then a bearish market is one where the opposite happens. In a bearish market, prices are declining, confidence is falling, and investors expect weaker economic performance ahead.
Bearish conditions often arise during economic downturns, recessions, or periods of uncertainty. During this time, investors lose confidence and become more pessimistic about the market outlook. A routine market correction can be seen as a signal of a larger crash, causing deeper sell-offs and pushing prices lower.
This causes even more volatility and uncertainty in the market, creating a negative feedback cycle driven by fear, uncertainty and doubt.
Bearish markets can be identified by these four key characteristics:
- Falling asset prices and weak buying momentum
- Investor pessimism and risk aversion
- Increased volatility as investors turn more reactionary
- Weak or contracting economic data
Technical Indicators of Bearish Sentiment
A bearish market typically develops when selling pressure outweighs buying interest and prices begin forming consistent downtrends. Traders look for a combination of technical signals that confirm weakening momentum and a shift toward pessimism.
1. Lower highs and lower lows
The most visible sign of a bearish trend is a chart pattern of lower highs and lower lows. Each rally fails to reach the height of the previous one, and each subsequent sell-off dips even lower. This price action signals that sellers are in control, and buyers lack the conviction to reverse momentum.
2. Moving averages sloping downward
In bearish conditions, moving averages (MA) turn lower and start charting downward slopes, reflecting sustained weakness over time.
- Short-term moving averages (like the 50-day MA) typically fall below the long-term averages (such as the 200-day MA).
- This pattern, ominously known as a death cross, often confirms that the market has transitioned into a longer-term downtrend.
- The steeper the downward slope, the stronger the bearish momentum.
3. Trading volume builds as prices fall
During a bearish phase, trading volume tends to increase when prices fall and taper off during brief rallies. This shows that more investors are actively selling off their holdings as conviction evaporates, while fewer are willing to step in and buy.
4. Relative Strength Index (RSI) below mid-range
The RSI is another key gauge of market momentum. In a bearish market, this indicator – which reads between 0 to 100 – often stays in the 20 to 40 range, signaling persistent selling pressure.
In general, an RSI consistently below 50 indicates that downward momentum is dominant. When RSI dips below 30, this is often taken as the market being oversold. In strong bear markets, RSI can remain at low levels for extended periods.
5. Negative MACD crossover
The Moving Average Convergence Divergence (MACD) indicator helps confirm bearish momentum when the MACD line crosses below its signal line.
- When both lines are moving downward and the histogram turns negative, it points to strengthening downside momentum.
- Sustained MACD readings below zero further reinforce the bearish trend.
6. Breakdown below support levels
Support levels act as floors for prices during normal market moves. These are levels that prices do not fall beyond in normal trading circumstances. In a bearish market, however, prices often break down below key support zones, triggering stop-loss orders and accelerating selling pressure.
When breakdown below support is confirmed by other signs of weakness – in particular, high trading volume – it suggests that sentiment has turned decisively negative.
7. Rising volatility and widening credit spreads
Traders often refer to the Volatility Index (VIX) to read or confirm market trends. Bearish markets are accompanied by higher volatility, as evidenced by rising VIX levels. There is also intensified movement towards safe-haven assets, indicating investors are becoming more risk-averse.
Taken together, these technical indicators help traders identify when a market has entered or confirmed a bearish phase. While short-term rebounds may occur, sustained bearish signals across multiple timeframes typically indicate underlying weakness.
A Recent Example of a Bearish Market
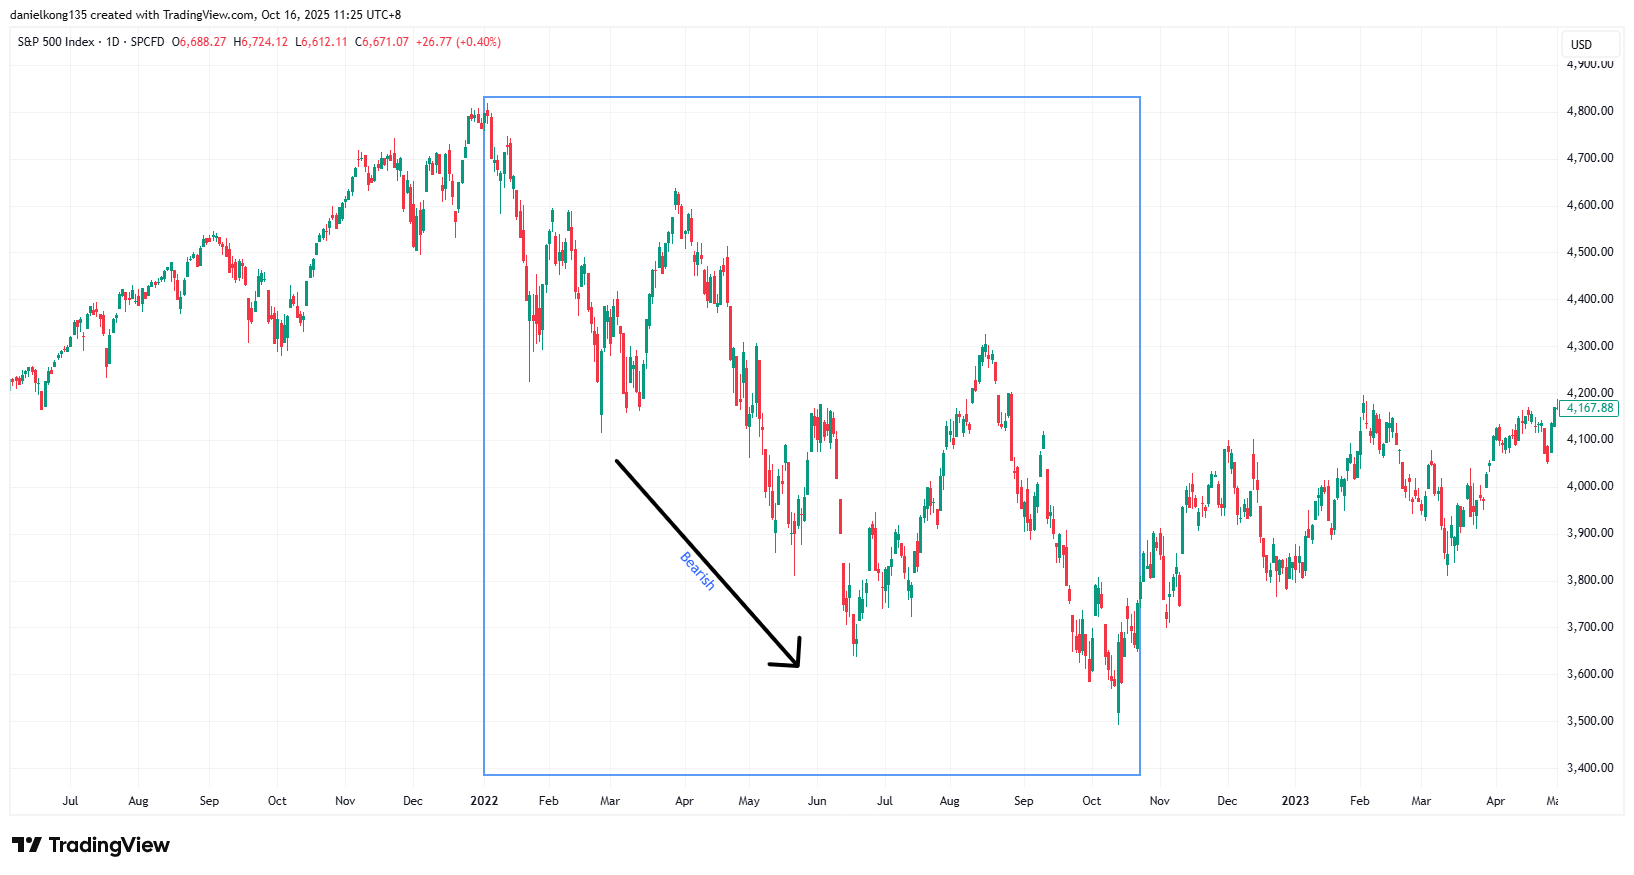
One of the most recent bear markets occurred between January and October 2022, when the S&P 500 fell by roughly 25% from its peak. This was the steepest annual drawdown since the 2008 financial crisis.
The downturn was driven by a combination of factors including surging inflation, aggressive interest rate hikes by the U.S. Federal Reserve, and fears of a potential recession. Rising borrowing costs weighed heavily on high-growth sectors such as technology, while corporate earnings forecasts weakened amid slowing consumer demand.
In response, investor sentiment turned sharply risk-averse, prompting a shift from equities into safe-haven assets like the U.S. dollar and Treasury bonds. By October 2022, the market had entered a clear bearish phase, reflecting widespread concern about economic stability and tighter financial conditions.
Bullish vs Bearish – Key Differences at a Glance
| Feature | Bullish Market | Bearish Market |
| Market direction | Prices rising, higher lows and higher highs, breaks through previous resistance levels | Prices falling, lower highs and lower lows, falls below previous support levels |
| Investor sentiment | Optimistic, confident | Pessimistic, fearful |
| Economic signals | Strong GDP growth, low unemployment, falling interest rates | Weak growth, rising unemployment, rising interest rate |
| Trading volume | Higher due to increased buying activity | Lower as investors hold back |
| Common examples | S&P 500 rally that started in October 2022 to April 2025 | S&P 500 bear market of 2022, from January 2022 to October 2022. |
How to Identify if a Market is Bullish or Bearish
Recognising whether a market is bullish or bearish requires more than just watching prices rise or fall. Traders and investors typically use a combination of technical, fundamental, and sentiment analysis to build a complete picture of market direction and strength.
Each approach offers different insights, with technical analysis focussing on price action, fundamental analysis examining the underlying economy, and sentiment analysis gauging investor mood.
Using Technical Analysis
Technical analysis is the study of price charts and trading patterns to identify market trends. One widely used technical indicator is the moving average (MA).
When short-term averages, such as the 50-day MA, move above long-term averages, like the 200-day MA, it forms what traders call a golden cross – a classic signal of a bullish market. The reverse pattern (when the short-term average crosses below the longer-term average), known as a death cross, indicates a shift toward bearish conditions.
The Relative Strength Index (RSI) is another useful indicator, measuring the speed and magnitude of recent price movements. Readings above 50 generally suggest upward momentum, while readings below 50 indicate downward pressure. An RSI that stays above 60 often confirms a healthy bull trend, whereas sustained levels below 40 typically align with a bear market.
Thirdly, the Moving Average Convergence Divergence (MACD) helps traders identify changes in momentum. When the MACD line crosses above its signal line, it can signal the start of a bullish phase. A crossover below the signal line, especially when combined with declining volume, suggests momentum is fading and a bearish turn may be developing.
Using Fundamental Analysis
While technical indicators help decipher what price movements mean, fundamental analysis explains why prices are moving that way. The practice looks at the broader economic and financial factors that drive markets.
In bullish conditions, economic fundamentals often show strong GDP growth, rising corporate earnings, low unemployment, and manageable inflation – all of which signal a healthy economy that supports rising asset prices.
In contrast, bearish markets tend to emerge when fundamentals weaken. Slowing economic growth, shrinking profits, or aggressive interest rate hikes can all pressure stock markets, forcing prices to fall.
Traders may watch quarterly earnings reports, inflation data, and central bank announcements closely; a pattern of deteriorating numbers often confirms a bearish environment.
Using Sentiment Analysis
Market sentiment captures how investors feel about the market – optimistic or pessimistic – and often acts as an early warning system before trends become obvious in data or price charts.
One popular tool for sentiment analysis is the VIX (Volatility Index), also known as the market’s “fear gauge”. VIX tends to remain low and stable during bullish periods, reflecting confidence. When the VIX spikes, it signals heightened uncertainty or fear, which often accompanies bearish conditions.
Beyond the VIX and other formal indicators, sentiment can also be measured through news headlines, social media trends, and moves made by institutional investors (the so-called “smart money”).
Widespread positive coverage, strong inflows into equity funds, and upbeat analyst forecasts often coincide with bull markets. On the other hand, headlines focused on recession risks or heavy institutional hedging point toward growing bearish sentiment.
By combining these three types of analyses – technical, fundamental, and sentiment – traders can gain a more rounded understanding of market conditions. No single indicator is foolproof, but when several signals align, they provide compelling evidence of whether a market is entering a bullish or bearish phase.
Bullish and Bearish Market Examples in 2025
As of 2025, markets have displayed a mix of bullish and bearish behavior, often depending on the sector or asset class.
- Bullish: AI-related stocks and semiconductors
Companies in the AI and semiconductor industries continue to attract investor attention, as demand for advanced computing, data center infrastructure, and AI applications remains strong.
For instance, Samsung recently projected one of its highest quarterly operating profits in years, driven by memory chip demand tied to AI workloads. Meanwhile, OpenAI has recently reached US$500 billion in valuation after a private deal, overtaking Elon Musk’s SpaceX as the world’s most valuable startup.
Another AI startup sharing the spotlight is startup AI cloud services provider CoreWeave, which saw shares jump up by 200% this year [1].
Several more examples abound in 2025: Broadcom’s shares have advanced by 40%; Palantir’s stock has risen by 131%; AI cybersecurity leader CrowdStrike gained 44%; and even Google’s stock has climbed 25% this year, despite investor worries over increased search competition [2].
- Bearish: Oil and commodities
The outlook for oil appears bearish as we approach the start of 2026. The US Energy Information Administration is forecasting Brent crude to decline to USD 62 per barrel in Q4 and further to USD 52 per barrel in 2026 [3].
The downward price pressure is attributed to faster-than-anticipated growth in global oil supply, with worsening oversupply next year due in part to increased OPEC+ output and “subdued” demand. This was according to a monthly report from the International Energy Agency [4].
How Traders React to Bullish vs Bearish Conditions
Savvy traders know to adjust their strategies and approach when market conditions change. In bullish markets, trading behaviour often focuses on capturing upside momentum. However, when conditions turn bearish, the focus switches to protecting capital and managing risk.
Traders during bullish markets
In bullish markets, traders often focus on momentum strategies, i.e., buying assets that are trending upward and holding them as long as the momentum remains strong. The idea is to utilise long positions to capture capital appreciation as prices tend to continue rising during a bull market. Traders rely on technical indicators like rising moving averages and strong volume to confirm continued strength in the trend.
Traders during bearish markets
In bearish markets, trader behaviour shifts toward capital preservation and risk management. Many participants use hedging strategies, such as purchasing put options or entering short positions, to offset potential losses in their portfolios. Short selling allows traders to profit from falling prices by borrowing and selling an asset, with the intention of buying it back at a lower price. However, these strategies carry additional risks and are typically used by more experienced traders to balance exposure during downturns.
Another defensive tactic in bear markets is to rotate into safe-haven assets such as gold, government bonds, or stable currencies like the U.S. dollar or Swiss franc. These assets tend to retain or increase value when riskier markets decline, helping to smooth portfolio volatility. Traders may also diversify across asset classes or increase cash holdings to reduce exposure until clearer bullish signals reappear.
Trade both bull and bear markets with Vantage CFDs
Vantage Contracts-for-Difference (CFDs) allow traders to trade both bull and bear markets without ownership of underlying assets or securities. Choose to open either long or short positions, allowing you to potentially profit in all market conditions.
Vantage provides margin trading on CFDs for increased flexibility and greater capital efficiency – you can control more positions with your budget, or start trading with a lower capital. Hedge against risk and market volatility with our sophisticated stop-loss and take-profit orders to optimise your trading outcomes.
Common Mistakes When Reading Market Trends
Even experienced traders can misread market signals, especially during volatile periods. Emotions like fear and overconfidence often cloud judgment, leading to poor decisions. Recognising these patterns helps traders stay objective and data-driven.
A common mistake is confusing short-term volatility with a true trend change. Markets often see brief pullbacks or rallies that look dramatic but don’t signal a lasting shift. A short dip during a bull run, for example, may simply reflect profit-taking. Skilled traders wait for confirmation from indicators such as volume, moving averages, or broader economic data before calling a reversal.
Overconfidence in bull markets is another trap. When prices rise steadily, traders may assume gains will continue and take on excessive risk or ignore stop losses. Typically, this false optimism often peaks just before downturns, leading to avoidable losses. Staying disciplined and following a clear trading plan helps prevent costly mistakes.
In bear markets, panic selling is a common, yet costly, mistake. Sharp declines often trigger emotional reactions, leading traders to sell near the bottom and miss later recoveries. Focusing on analysis rather than emotion allows traders to navigate downturns more rationally.
Ultimately, successful trading relies on discipline and perspective. Markets move in cycles, and by avoiding emotional reactions, traders can make steadier, more informed decisions over time.
Learn to Make Friends with Bulls and Bears
Bullish and bearish markets represent two sides of the same cycle. Prices, sentiment, and economic indicators constantly shift, creating opportunities and risks alike. Understanding the signs of each condition helps traders and investors stay prepared, adapt their strategies, and navigate market changes with greater confidence.
Markets will always move in cycles. The key is knowing which part of the cycle you’re in and responding with clarity rather than emotion.
References
- “This Analyst Thinks CoreWeave Stock Can Jump 50%. Should You Buy CRWV Now? – Yahoo!Finance”. https://finance.yahoo.com/news/analyst-thinks-coreweave-stock-jump-155404737.html . Accessed 16 Oct 2025.
- “Fee-Fi-Fo-Fum: Is A Giant Crash Brewing For AI Stocks? – Investor’s Business Daily”. https://www.investors.com/news/technology/artificial-intelligence-stocks/ . Accessed 16 Oct 2025.
- “Short-Term Energy Outlook – US Energy Information Administration”. https://www.eia.gov/outlooks/steo/ . Accessed 16 Oct 2025.
- “Global oil supply seen growing at faster pace this year, IEA says – Investing.com”. https://ca.investing.com/news/commodities-news/global-oil-supply-seen-growing-at-faster-pace-this-year-iea-says-4243667 . Accessed 16 Oct 2025.