There are moments in the market when prices pause, gather strength, and quietly prepare for their next chapter.
The cup and handle pattern is one of the chart formations traders may observe in such moments. It looks simple at first glance, almost like a teacup resting on a table, yet inside this gentle curve is a story of accumulation, confidence, and patient buyers returning to take control.
For newer traders, the cup and handle pattern can seem mysterious. Why does it look the way it does, and what is it trying to tell you? More importantly, how can you use it as part of your trade analysis?
In this guide, we break everything down with clear explanations, relatable analogies, and examples that make sense when applying the cup and handle pattern in your trading strategies.
What Is a Cup and Handle Pattern?
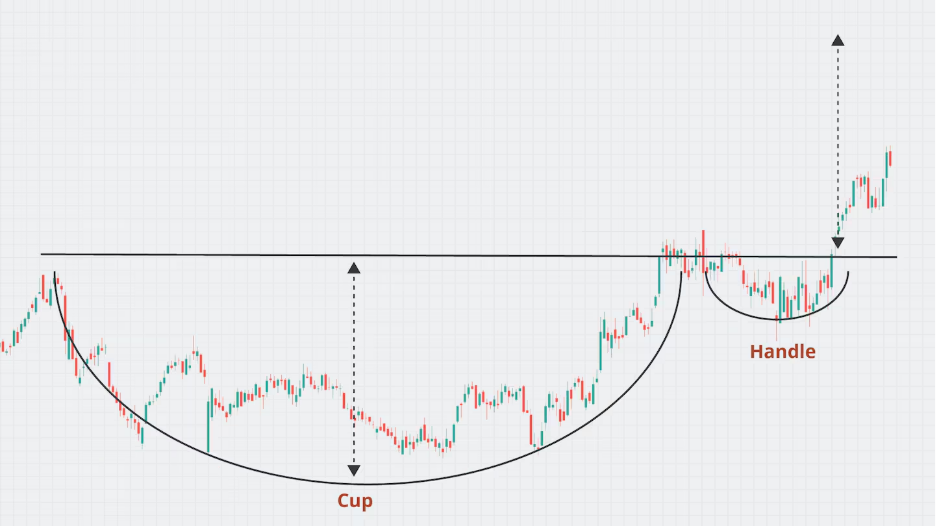
A cup and handle pattern is a bullish continuation pattern that signals renewed upward momentum. Picture a rounded ‘cup’ followed by a smaller ‘handle’, forming on the right side of a price chart.
The cup forms when the price drops from a previous high, slowly finds support, then climbs back to revisit that same high. On daily and weekly charts, this curved U-shape often develops over a steady period, reflecting a phase where sellers have faded, buyers have quietly accumulated, and sentiment has shifted back to optimism.
The handle forms when price hesitates near the old high. A small pullback appears, almost like the market catching its breath before breaking out. When buyers step back in and push the price above the handle’s resistance, it often sets the stage for a new upward run.
Is the Cup and Handle Pattern Bullish?
As a general rule, the cup and handle pattern is typically bullish. It shows that the market has absorbed selling pressure, regained confidence, and is preparing for another push upwards.
Think of it like an athlete slowing down, regrouping, and gathering energy before sprinting again.
History of the Cup and Handle Pattern
The cup and handle pattern was first introduced by William J. O’Neil in his book “How to Make Money in Stocks”. O’Neil had spent years studying how top-performing stocks behaved before their strongest climbs, and he noticed that many of them moved through a familiar cycle:
- Prices would fall as fear took hold and sellers congregate, before forming a rounded recovery as confidence slowly returned, creating the ‘cup’.
- A brief pullback would then emerge, signalling a moment of hesitation where early sellers tested the market’s resolve. This becomes the ‘handle’.
- Once that final doubt passed, the price often breaks out with renewed conviction.
O’Neil realised he wasn’t just identifying a predictable chart pattern; he was mapping investor psychology. The shape captured how crowds behave when they shift from uncertainty to accumulation, a cycle that appears across various trading products on the market.
Although his original framework was designed for long-term investors who wanted to capture powerful multi-month trends, traders can adapt it for shorter time horizons by adjusting their measurements and targets.
Over the years, researchers have examined the cup and handle’s success rate and found that it strengthens with time. A cup typically forms over one to six months, followed by a handle lasting one to four weeks.
Studies also show that the pattern performs best on higher timeframes, especially daily and weekly charts where emotional cycles fully develop without intraday noise.
According to Thomas Bulkowski, a leading expert and author in trading, his market studies reveal a 65 to 70% success rate, with an average rise of 24% after breaking out past the resistance level1. These results are historical observations and do not guarantee future performance, which can vary significantly depending on market conditions.
In essence, the durability of the cup and handle pattern reflects a broader truth about market structure. When viewed over longer timeframes, price movements often mirror recurring shifts in sentiment, and this pattern captures that progression in a clear, recognisable way.
6 Key Rules to Identify a Cup and Handle Pattern
Here are the essential rules traders use to confirm that what they are seeing is a true cup and handle rather than a random curve on a chart.
1. There Must Be a Prior Uptrend
A cup and handle pattern is a bullish continuation signal, so it should form after an established upward trend.
Without a preceding uptrend, the pattern loses its context and becomes less reliable.
2. The Cup Must Be U-Shaped, Not V-Shaped
A valid cup forms gradually, creating a U shape with the price rounding out over time rather than snapping into a sharp V.
A rounded U shape shows sustained accumulation while a V shape usually reflects volatility or a fast corrective move, which reduces the reliability of any follow-through breakout.
Ideal Structure:
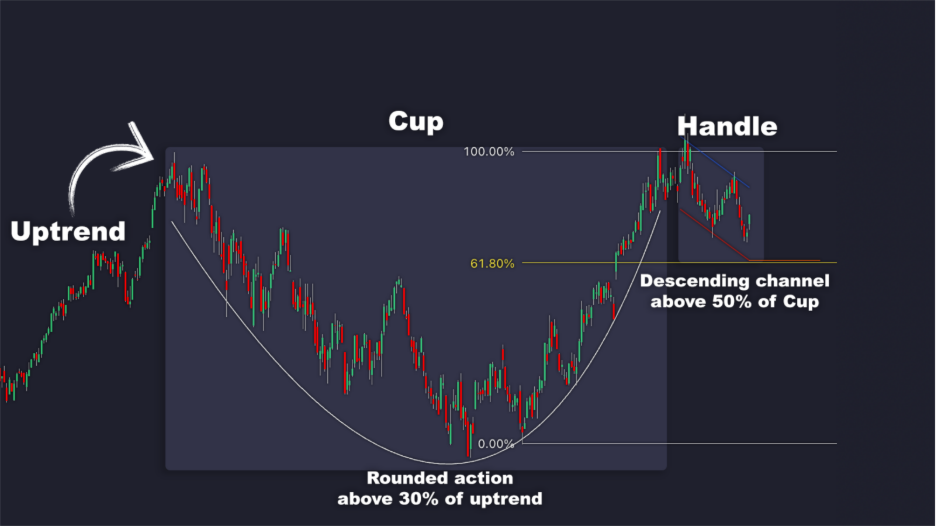
- Fibonacci Depth: Around 50% retracement of the prior trend
- Volume: Typically declines as price reaches the bottom
- Cup Length: Longer cups (1–6 months) are typically stronger1
- Base Depth: 12–35% pullback2
3. The Cup Should Take Longer to Form Than the Handle
The cup phase reflects accumulation and usually forms over weeks to several months, depending on the timeframe. The handle is a shorter consolidation phase, often lasting one to four weeks on daily charts.
A handle that lasts significantly longer than the cup may indicate weakening momentum or evolving market conditions that no longer support continuation.
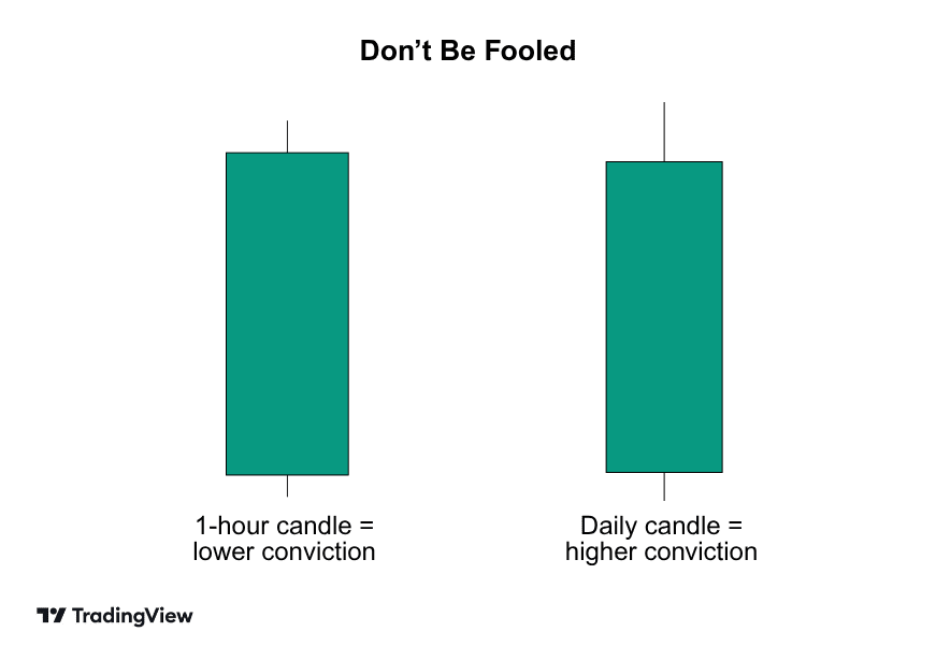
A daily candle contains the activity of 24 one-hour candles, meaning volume and conviction are clearer on higher timeframes. This is why the cup and handle typically evaluates more reliably on daily or weekly charts.
4. The Cup’s Highs Should Align to Form Clear Resistance
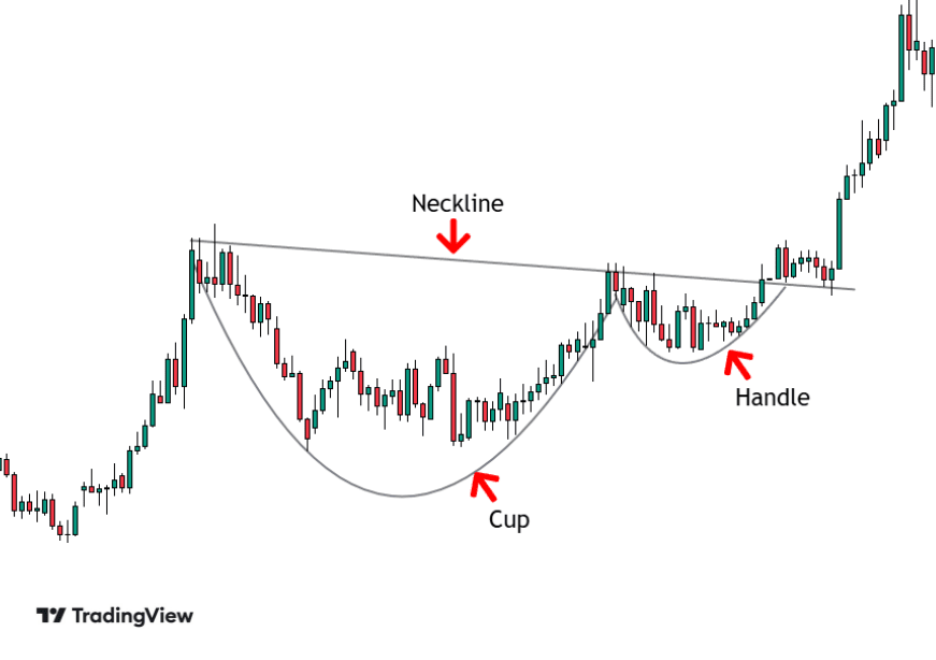
The left and right sides of the cup should rise to nearly the same price level as before, creating a clean horizontal resistance line. This level becomes the key decision point where buyers and sellers meet—and where a breakout turns meaningful.A well-defined resistance line improves pattern clarity and increases technical validity.
5. The Breakout Must Occur Above the Handle’s High
The cup and handle pattern is not considered complete until price breaks above the handle’s resistance. A valid breakout should ideally occur with:
- A strong bullish candle
- A close above the resistance line
- A handle that formed through tight consolidation
Without a clear breakout, the pattern remains unconfirmed and may simply represent a consolidation without continuation.
6. The Volume Must Confirm the Pattern
Volume plays a critical role in validating the cup and handle pattern.
Traders generally look for:
- Decreasing volume as the cup forms
- Lower volume during the handle
- A surge of around 40% or more above the 20-period average can sometimes occur during a breakout. In some historical market examples, stronger breakouts have shown volume increases of 200%, 500%, or even 1,000%.2 However, these figures are illustrative only, as volume behaviour varies widely across instruments and market conditions.
Think of volume as a measure of market agreement where every trade is a vote of confidence. A breakout supported by thousands of ‘votes’ (broad participation) is more robust than one occurring on thin trading.
How to the Cup and Handle Pattern Is Commonly Traded
Trading a cup and handle pattern comes down to three essentials: (1) knowing where to enter, (2) where to place your stop, and (3) where to take profit. This technical chart pattern unfolds gradually, often building momentum over time.
Many traders aim to identify the confirmation point, step in at the right moment, manage risk appropriately, and let the move play out if conditions remain favourable.
Stage 1: Calculating the Target
To estimate a potential target, traders typically measure the depth of the cup—from the lowest point of the base up to the resistance line at the rim.
Once the price breaks out of the handle, this distance can be projected upward from the breakout level as an illustrative example. Actual market movements may differ, and no specific outcome is guaranteed.
Think of it like pouring water from a cup: The deeper the cup, the more potential energy it holds. Deeper cups may also indicate stronger underlying accumulation.
Short-term traders sometimes adapt this measurement by taking partial profits early or adjusting the projection based on their risk appetite and trading timeframe.
Stage 2: Finding the Entry Point
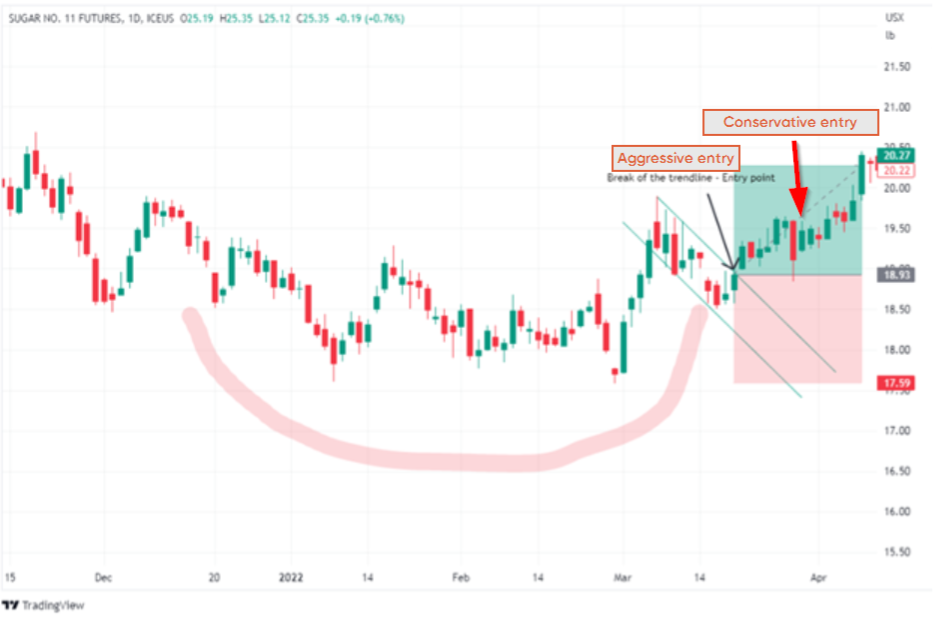
The handle is where timing matters. A healthy handle forms as a brief, controlled pullback—often a small downward-sloping channel, a mild dip, or a tight consolidation triangle.
Entries generally fall into two categories:
- Aggressive Entry: Some traders may place a buy stop just above the handle’s trendline. This approach aims to capture the earliest phase of a potential breakout, though it carries a higher risk of false signals.
- Conservative entry: Some traders wait for a confirmed breakout above the handle’s resistance and then look for a retest of the breakout level. This may provide additional confirmation, although the market does not always provide a pullback.
Volume can help validate the setup: Lighter volume during the handle suggests controlled selling or consolidation, while stronger volume on the breakout indicates increasing participation.
Stage 3. Placing the Stop-Loss
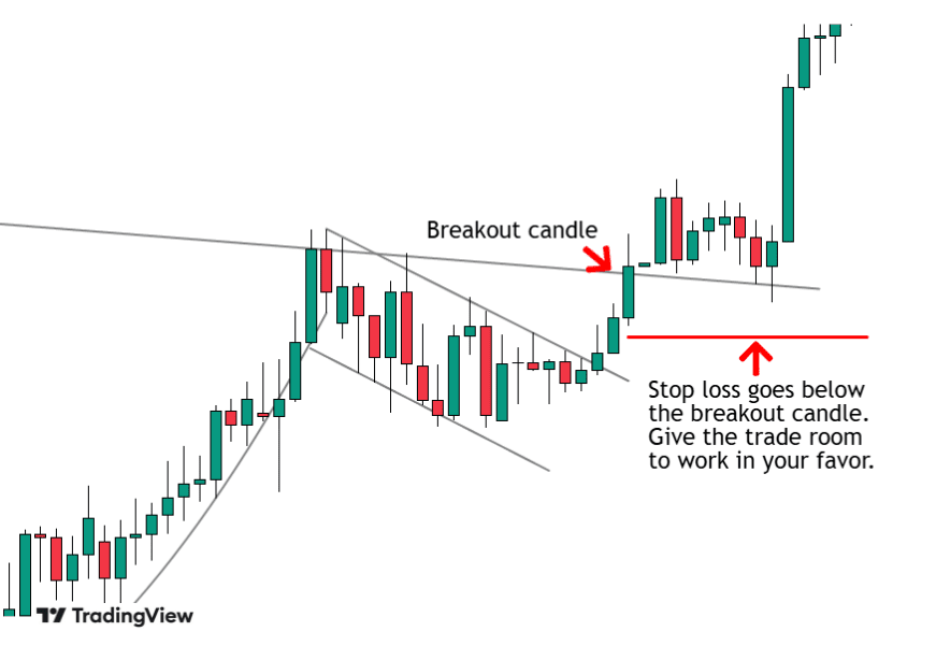
Stop-loss orders are usually placed below the handle’s low or the most recent swing low, depending on the market structure. Strong cup and handle patterns typically form in the upper half of the cup, ideally the upper third.
If the stop must be positioned below the midpoint of the cup, it may signal a weaker technical chart formation or an unfavourable risk-to-reward profile, prompting traders to reassess whether the setup is worth taking.
Stage 4. Choosing the Exit
Most traders use the cup depth added to the breakout point as their primary target projection.
More conservative traders may use a shorter measurement—especially if the cup is uneven—while aggressive traders may push for the full extension or scale out at multiple levels.
Intraday traders might close positions before the session ends due to volatility or session-based risk parameters, whereas trend-focused followers often trail their stop-loss to remain in the move as long as the trend persists.
5 Popular Strategy Tips for Trading a Cup and Handle Pattern
For traders who are new to the cup and handle chart pattern, these five commonly used tips offer additional insights to help evaluate the pattern more effectively. They are not trading signals but practical considerations that can support decision-making.
1. Prioritise Higher Timeframes
Cup and handle patterns tend to be clearer and more reliable on daily and weekly charts, where price movements are less affected by intraday noise. Higher timeframes provide a more accurate view of market sentiment and allow the pattern’s rounded base and handle to develop naturally.
While the pattern can appear on shorter timeframes, it may be more prone to false signals during volatile sessions.
2. Look for Supportive Market Context
A cup and handle pattern is more meaningful when it aligns with the broader market conditions. Traders often consider:
- Whether the asset is already in a wider uptrend
- If related markets or sectors are stable or strengthening
- Whether broader economic or sentiment conditions support continuation
Evaluating the wider environment helps determine whether the pattern is forming as part of a continuation structure rather than against prevailing market pressure.
3. Avoid Handles That Are Too Deep or Too Long
A well-behaved handle usually pulls back only modestly, often staying in the upper half of the cup.
Handles that retrace too deeply, last excessively long, or show wide volatility may signal weakening momentum. This doesn’t invalidate the structure entirely, but it’s a sign to reassess whether market conditions still support continuation.
4. Use Additional Tools to Filter Breakouts
While the cup and handle pattern can be analysed on price action alone, many traders use complementary tools to help filter potential breakouts. These may include:
- Moving averages to confirm trend direction
- Momentum indicators like relative strength index (RSI) to check for divergence
- Volume profile to identify high-participation zones
These tools don’t guarantee outcomes but can help reinforce whether a breakout aligns with broader technical conditions.
5. Plan Your Risk Management Before Entering
Cup and handle breakouts can be sharp. But like any other chart pattern, they can also fail, especially during periods of uncertainty or volatility.
Before entering, traders often define:
- Maximum risk per trade
- Preferred stop-loss placement
- Acceptable risk-to-reward levels
- Conditions that would invalidate the setup
Planning risk management in advance helps reduce emotional decision-making once the market begins to move.
6 Common Mistakes to Avoid When Evaluating a Cup and Handle Pattern
Even when a setup seems promising, many traders unintentionally weaken the structure long before the breakout happens. These six common mistakes often reduce the reliability of the cup and handle pattern—but they can be avoided with careful analysis and discipline.
1. Treating Shallow, V-Shaped, or Forced Structures as Cups
Not every rounded dip is a valid cup.
Sharp V-shaped reversals, overly shallow pullbacks, or patterns drawn from bias usually lack the gradual accumulation typically associated with a reliable breakout.
Before treating any curve as a cup, ensure the structure develops naturally, rounds out over time, and aligns with the key characteristics of a classical cup and handle pattern.
2. Overlooking the Quality of the Handle
A well-formed handle usually drifts gently lower or moves sideways within a relatively tight range. Handles that are too steep, choppy, or erratic may reflect weak consolidation and reduced buyer conviction.
When the handle lacks structure, the pattern may be more prone to false breakouts or inconsistent follow-through.
3. Entering Before Volume Confirms the Breakout
Volume often provides important context for this chart pattern, as it generally contracts during the handle and surges when the breakout occurs—ideally 40% to 50% above average, sometimes more.
Entering before volume expands can expose traders to shallow or short-lived moves, as a lack of participation may signal that buyers have not fully committed to the breakout.
4. Placing Stops Either Too Tight or Too Wide
Stop-loss placement plays a meaningful role in managing risk.
Stops placed inside the handle may be hit by normal fluctuations, while stops positioned too far below the structure can create an unfavourable risk-to-reward profile.
A balanced approach is to place stops just below the handle’s low or a nearby swing low, depending on market conditions and volatility.
5. Ignoring Market Context and Liquidity
Cup and handle patterns tend to form more cleanly in markets with sufficient liquidity and within an existing broader trend.
Attempting to apply the pattern during choppy conditions, low-volume periods, or counter-trend environments often results in irregular shapes and unreliable signals. Assessing trend strength, volatility, and liquidity helps determine whether the pattern is developing under supportive conditions.
6. Assuming Every Breakout Will Reach the Projected Target
The classical textbook target—the depth of the cup projected from the breakout point— is only a guide.
Breakouts with weaker momentum, lacklustre volume, or inconsistent follow-through tend to fall short of the projection. Treat the target as estimate, and manage trades based on evolving market conditions instead of relying solely on the measured-move calculation.
4 Limitations of the Cup and Handle Pattern
Like all technical chart patterns, the cup and handle is not perfect. Some limitations include:
1. False Breakouts
False breakouts can occur when momentum weakens, liquidity thins, or market conditions become unstable. Price may break above the handle’s resistance only to reverse shortly afterward, resulting in a false breakout.
While longer and more rounded cups are generally considered clearer structures, they do not guarantee reliability. Shallow or overly deep cups may introduce additional uncertainty, so evaluating the overall construction of the pattern is important before interpreting the breakout.
2. Timeframe Sensitivity
The cup and handle pattern often appears more clearly on higher timeframes, such as daily or weekly charts. On shorter intraday intervals, price action tends to be noisier, and the technical formation may be less distinct due to rapid fluctuations or temporary volatility.
Although the cup and handle pattern can form on any timeframe, it typically requires smoother, more orderly price movement to develop correctly—conditions that are more common on longer-term charts.
3. Structural Sensitivity to Volatility
The cup and handle pattern depends on gradual, rounded recovery followed by a controlled consolidation.
In highly volatile or uncertain markets, sudden large candles, sharp reversals, or wide intraday swings can distort the cup’s curvature or interrupt the handle, making the pattern harder to recognise.
Elevated volatility can also affect breakout behaviour, leading to inconsistent follow-through even when the breakout level is reached. As such, the pattern tends to be clearer when market conditions support steadier and more orderly price development.
4. Not Always Applicable Across All Instruments
Although the cup and handle pattern can appear across stocks, forex, indices, and commodities, its reliability can vary.
Instruments with low liquidity, wide spreads, or frequent gaps may struggle to form the smooth U-shape and tight handle that the pattern requires.
Additionally, markets prone to sudden news-driven movements may disrupt the structure, making the pattern less consistent across certain assets.
The Bottom Line for the Cup and Handle Pattern
More than just a visual shape, the cup and handle pattern is a powerful tool for understanding market behaviour. It tells a story of chart movements from decline to recovery, followed by a short period of consolidation and renewed upside momentum.
When interpreted within the broader trend, the cup and handle can help traders identify potential continuation setups. However, like any chart pattern, it should not be relied on in isolation.
It’s always best to combine the cup and handle pattern with trend analysis, momentum indicators, volume studies, and other chart structures to get a more complete picture of the markets.
This technical formation becomes even more effective when paired with proper risk management and an understanding of the wider market environment. Traders who want to analyse the cup and handle pattern in live conditions can explore CFD stock trading by opening a Vantage Live Account or practice trading in a risk-free environment with a Demo Account.
FAQ: Common Questions on Cup and Handle Pattern
1. Is the cup and handle a bullish pattern?
Yes. The cup and handle is generally considered a bullish continuation pattern that signals renewed buying interest after a period of consolidation.
2. What are the rules for the cup and handle pattern?
The key rules for a cup and handle pattern include:
- A prior uptrend
- A rounded U-shaped cup
- A relatively shallow downward- or sideway-sloping handle
- Aligned highs forming a resistance level, and
- A breakout above the handle, ideally supported by higher volume
These guidelines help distinguish a classical cup and handle from less reliable formations.
3. What is the success rate of the cup and handle pattern?
The success rate of the cup and handle pattern vary significantly across markets, instruments, and timeframes.
Research in technical analysis often shows clearer and more consistent performance on daily and weekly charts, where price action tends to be smoother and less affected by intraday noise.
Bear in mind that no success rate is guaranteed, and trading outcomes heavily depend on prevailing market conditions.
4. How often does the cup and handle pattern work?
The cup and handle pattern often works more consistently in steady trending environments where accumulation is visible and volatility is moderate.
Its reliability decreases in highly volatile, low-liquidity, or sideways markets, where the cup and handle structure may form irregularly or fail to complete.
References
- “Cup and Handle Pattern: Meaning, Rules, and Trading – InvestinGoal”. https://investingoal.com/trading/chart-pattern/cup-and-handle/. Accessed on 1 December 2025.
- “What Is The Cup And Handle Pattern? – TraderLion”. https://traderlion.com/technical-analysis/cup-and-handle-pattern/. Accessed on 20 November 2025.