


Brent, WTI Crude Oil Prices Today: Why the Rally Just Reversed
 Updated Updated Tue, 2026 July 28 08:07

Crude oil just proved how fast a war premium can evaporate. Brent and WTI crude oil prices today are sitting well below the highs touched only a few sessions ago, after one of the sharpest reversals crude has produced all year. As of 09:36 (GMT+8) / 01:36 UTC on 28 July 2026, the Vantage USOUSD CFD (WTI) traded near $82.11 a barrel, while the Vantage UKOUSD CFD (Brent) sat near $87.33.
Both benchmarks have fallen sharply from their late-July highs, with Brent approaching $100 and WTI reaching above $92, after signs of an easing Middle East conflict took the geopolitical premium out of the market almost as quickly as it arrived.
Here’s what the oil price chart is showing, and the levels traders are watching this week. We’re reading the chart, not calling the trade.
Key Points
- Brent and WTI crude oil prices reversed hard after the US paused strikes on Iran and Tehran said it had halted retaliatory action, sending both benchmarks down more than 7% in a single session on Monday, 27 July 2026.
- The EIA’s July Short-Term Energy Outlook, published 7 July 2026, had already pencilled in a calmer third quarter for Brent near $74 a barrel. Three weeks later, renewed volatility highlighted the geopolitical uncertainty surrounding that forecast.
- Shipping data shows Strait of Hormuz traffic remains severely depressed, while vessel crossings through Bab el-Mandeb recently fell to a multi-month low.
What the Oil Price Chart Is Showing
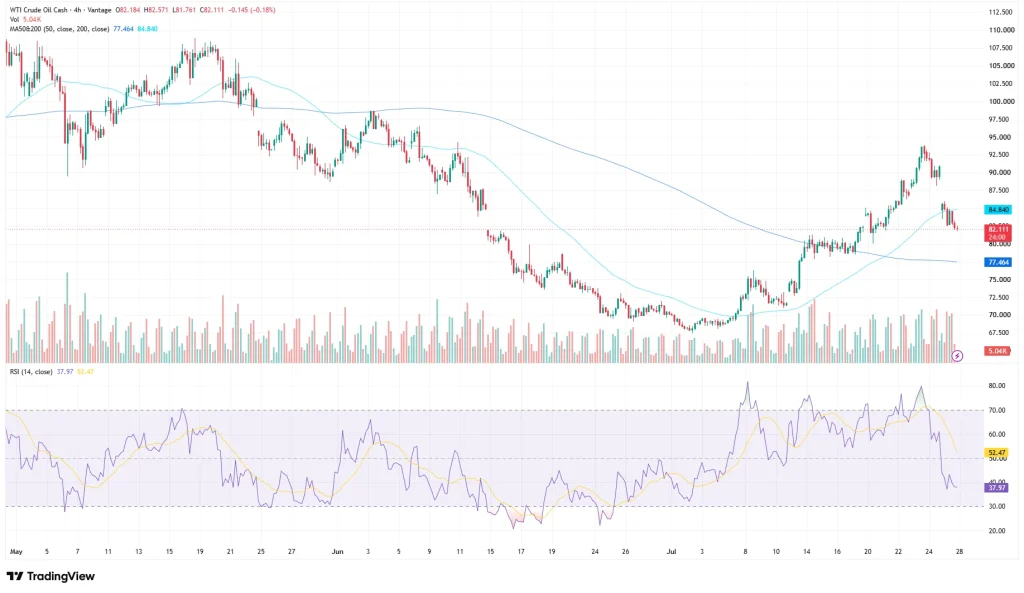
On the four-hour Vantage USOUSD CFD chart, WTI opened at $82.18, ranged between $82.57 and $81.76, and last traded near $82.11, down $0.15 (-0.18%) on the session, with volume near 5.04K on the Vantage CFD feed. The bigger picture is a full round trip: WTI fell from above $105 in early May to a low near $68 in early July 2026, then rallied more than 30% to a swing high above $92 by late July 2026, before the past two sessions retraced a substantial portion of that rally.
The 50-period moving average sits at $77.46 and the 200-period average at $84.84 on the chart used for this analysis, so price is sitting above the shorter average and below the longer one. The RSI (14, close) on the TradingView setup used for this analysis reads 37.97, below its own moving-average line of 52.47, showing how sharply short-term momentum has deteriorated.
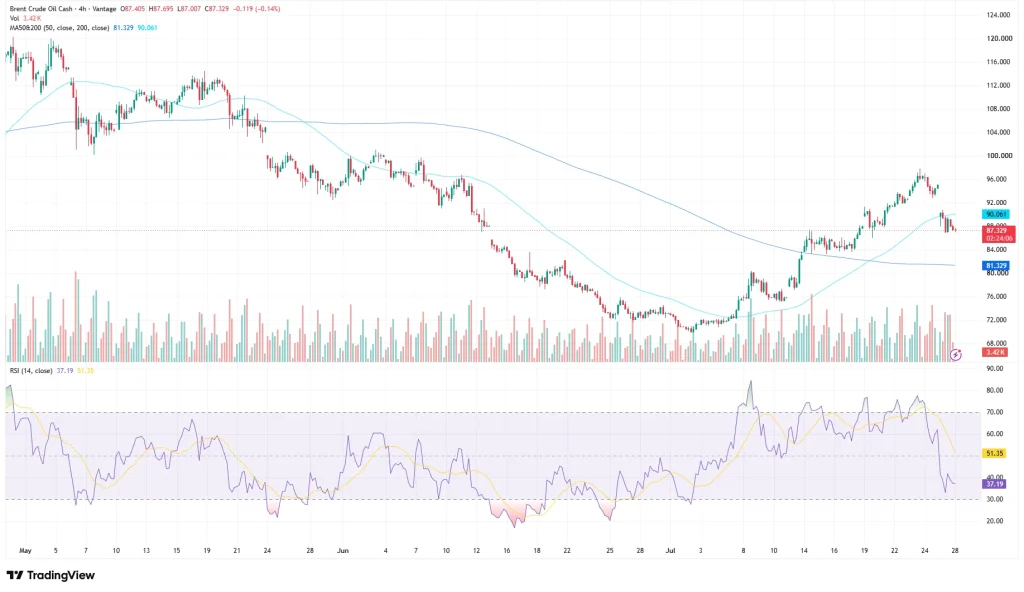
Brent tells the same story from a different starting point. The Vantage UKOUSD CFD opened at $87.41, ranged between $87.70 and $87.01, and last traded near $87.33, down $0.12 (-0.14%), on volume near 3.42K on the Vantage CFD feed.
Brent fell from above $117 in early May to a low near $70 in early July 2026, then rallied toward $100 in the back half of July 2026 before Monday’s reversal. The 50-period moving average reads $81.33 and the 200-period average $90.06, again sandwiching price between the two. The RSI reads 37.19 against a moving-average line of 51.35, in step with WTI’s bearish momentum shift.
Crude Oil News Today: Why the Rally Just Reversed

The crude oil news driving today’s price action comes down to one Monday move. Prices fell through the session on 27 July 2026 as Saudi Arabia’s air defences intercepted drones launched from Iraq, even as Yemen’s Houthi forces said they had targeted crude supply and transport sites linking eastern Saudi Arabia to the Red Sea export hub of Yanbu.[1] Brent settled at $88.36, down 8.7% and its lowest close since 17 July 2026; WTI settled at $82.61, down 7.5% and its lowest close since 16 July.[1]
The move followed the US pausing its campaign of strikes against Iran, with Tehran saying it had halted retaliatory action and entered talks with Oman over the Strait of Hormuz.[2] Separately tracked data show WTI fell as low as $82.11 intraday before trimming losses toward $83.40.[2]
It’s one of the larger single-day declines of the year: oil tumbled around 8% on Monday, the biggest one-day drop since 25 May.[3] Context matters here. Oil surged nearly 40% this month as disruptions spread from the Strait of Hormuz to the Red Sea, after Houthi forces claimed attacks on two Saudi tankers and announced a naval blockade of the kingdom, briefly pushing Brent above $100 a barrel for the first time since May.[4] Coverage of Monday’s move described prices sliding once the US paused strikes and tensions eased, even as Houthi forces kept claiming attacks on Saudi targets.[5]
Not everyone reads this as a clean resolution. One oil market commentator put it bluntly: the market seems to be “forever seeking good news from an arena that really is not providing any”.[1] Others point to the tape, not the headlines: shipping trackers recorded fewer than ten vessels a day moving through the Strait of Hormuz over the weekend, against a normal flow of roughly 20 million barrels a day.[1] A political pause doesn’t put oil on the water any faster.
The EIA Outlook Meets a Choppier Reality
There’s a real tension between this month’s price swings and the official supply outlook. The EIA’s July Short-Term Energy Outlook, published 7 July 2026, assumed calmer seas ahead. It followed the 18 June memorandum of understanding between the US and Iran that eased the earlier closure of the Strait of Hormuz and lifted tanker traffic through the waterway.[6] On that basis, the EIA forecast Brent’s average price for the third quarter of 2026 at $74 a barrel, a quarterly average rather than a near-term price target, and $82 across the full year, expecting production and trade flows to return close to pre-conflict levels by year end.[6] Brent’s spot price had averaged $85 a barrel in June 2026 and fallen further, below $70, by 1 July 2026.[7]
The subsequent rebound toward $100 nevertheless highlighted the geopolitical uncertainty surrounding that outlook, with Brent revisiting that territory before Monday’s sharp pullback. The EIA’s own outlook also flagged something worth weighing alongside crude oil prices today: global oil consumption is forecast to fall by an average of 1.2 million barrels a day in 2026, with most of that decline concentrated in Asia, the region most exposed to elevated energy costs and a softer trade backdrop.[8]
Put together, Monday’s rally in risk appetite looks more like a repricing of imminent-escalation risk than proof the underlying disruption is resolved. Both WTI and Brent have fallen below their 200-period moving averages after the late-July reversal while remaining above their 50-period averages. RSI has dropped into the high-30s and below its moving-average line on both charts, indicating weakening short-term momentum without reaching conventional oversold territory.
Levels to Watch This Week
The table below covers the zones active traders are watching on both crude oil CFDs. These are reference levels, not trade signals.
| Pair | Potential Support | Potential Resistance | What’s Happening |
| USOUSD (WTI) | $77.46 (50-period MA) | $84.84 (200-period MA) / $92-$93 (July swing high) | Trading between its two moving averages after Monday’s reversal |
| UKOUSD (Brent) | $81.33 (50-period MA) | $90.06 (200-period MA) / $96-$100 (late-July resistance zone) | Holding above its 50-period average but capped below its 200-period average |
Table 1: Key levels as of 09:36 (GMT+8) / 01:36 UTC, 28 July 2026. Sources: TradingView, Vantage CFD feed.
What to Watch
- US Crude Inventories, 29 July 2026: the EIA’s weekly petroleum status report is due, a read on how fast US supply has adjusted to the recent disruption.[9]
- Strait of Hormuz and Red Sea Shipping Data, ongoing: tanker-tracking updates remain the clearest gauge of whether this week’s pause is holding on the water, not just in the headlines.
- Next EIA Short-Term Energy Outlook, 11 August 2026: will show whether the agency revises its third-quarter Brent estimate given the past fortnight’s volatility.[6]
Crude oil prices today have moved by several dollars a barrel within single sessions, and this past week shows how fast that range can widen again on one headline. For CFD traders, the recent expansion in intraday ranges highlights the importance of accounting for volatility when assessing risk, while simultaneous exposure to both crude benchmarks can increase concentration in the same underlying oil-market risk.
Leverage magnifies both gains and losses, making risk exposure particularly important around inventory releases and fast-moving geopolitical headlines.

RISK WARNING: CFDs are complex financial instruments and carry a high risk of losing money rapidly due to leverage. You should ensure you fully understand the risks involved and carefully consider whether you can afford to take the high risk of losing your money before trading.
Disclaimer: The information is provided for educational purposes only and doesn’t take into account your personal objectives, financial circumstances, or needs. It does not constitute investment advice. We encourage you to seek independent advice if necessary. The information has not been prepared in accordance with legal requirements designed to promote the independence of investment research. No representation or warranty is given as to the accuracy or completeness of any information contained within. This material may contain historical or past performance figures and should not be relied on. Furthermore estimates, forward-looking statements, and forecasts cannot be guaranteed. The information on this site and the products and services offered are not intended for distribution to any person in any country or jurisdiction where such distribution or use would be contrary to local law or regulation.
References
[1] “Oil prices settle at lowest in over a week, as US pauses attacks on Iran – Yahoo Finance (Reuters)” https://finance.yahoo.com/energy/articles/oil-slips-more-5-us-221044741.html Accessed on 28 July 2026.
[2] “Crude Oil – Price – Chart – Historical Data – News – Trading Economics” https://tradingeconomics.com/commodity/crude-oil Accessed on 28 July 2026.
[3] “Here we go again. Why oil keeps tumbling even when the Iran war drags on – CNN Business” https://www.cnn.com/2026/07/27/economy/oil-prices-fall-iran-war Accessed on 28 July 2026.
[4] “Oil prices surge to $100 per barrel after Red Sea attacks – NBC News” https://www.nbcnews.com/business/markets/oil-prices-rise-red-sea-attacks-houthis-saudi-trump-iran-war-rcna588851 Accessed on 28 July 2026.
[5] “Oil Slides as Supply Threats Ease in Middle East and Black Sea – Bloomberg” https://www.bloomberg.com/news/articles/2026-07-26/latest-oil-market-news-and-analysis-for-july-27 Accessed on 28 July 2026.
[6] “Short-Term Energy Outlook – U.S. Energy Information Administration” https://www.eia.gov/outlooks/steo/ Accessed on 28 July 2026.
[7] “EIA Increases Global Oil Production Forecast After Easing of Strait of Hormuz Disruption – U.S. Energy Information Administration” https://www.eia.gov/pressroom/releases/press590.php Accessed on 28 July 2026.
[8] “July 2026 Short-Term Energy Outlook (Full Report) – U.S. Energy Information Administration” https://www.eia.gov/outlooks/steo/pdf/steo_full.pdf Accessed on 28 July 2026.
[9] “Weekly Petroleum Status Report – U.S. Energy Information Administration” https://www.eia.gov/petroleum/supply/weekly/ Accessed on 28 July 202