Important Information

You are visiting the international Vantage Markets website, distinct from the website operated by Vantage Global Prime LLP
( www.vantagemarkets.co.uk ) which is regulated by the Financial Conduct Authority ("FCA").

This website is managed by Vantage Markets' international entities, and it's important to emphasise that they are not subject to regulation by the FCA in the UK. Therefore, you must understand that you will not have the FCA’s protection when investing through this website – for example:

  • You will not be guaranteed Negative Balance Protection
  • You will not be protected by FCA’s leverage restrictions
  • You will not have the right to settle disputes via the Financial Ombudsman Service (FOS)
  • You will not be protected by Financial Services Compensation Scheme (FSCS)
  • Any monies deposited will not be afforded the protection required under the FCA Client Assets Sourcebook. The level of protection for your funds will be determined by the regulations of the relevant local regulator.

If you would like to proceed and visit this website, you acknowledge and confirm the following:

  • 1.The website is owned by Vantage Markets' international entities and not by Vantage Global Prime LLP, which is regulated by the FCA.
  • 2.Vantage Global Limited, or any of the Vantage Markets international entities, are neither based in the UK nor licensed by the FCA.
  • 3.You are accessing the website at your own initiative and have not been solicited by Vantage Global Limited in any way.
  • 4.Investing through this website does not grant you the protections provided by the FCA.
  • 5.Should you choose to invest through this website or with any of the international Vantage Markets entities, you will be subject to the rules and regulations of the relevant international regulatory authorities, not the FCA.

Vantage wants to make it clear that we are duly licensed and authorised to offer the services and financial derivative products listed on our website. Individuals accessing this website and registering a trading account do so entirely of their own volition and without prior solicitation.

By confirming your decision to proceed with entering the website, you hereby affirm that this decision was solely initiated by you, and no solicitation has been made by any Vantage entity.

I confirm my intention to proceed and enter this website Please direct me to the website operated by Vantage Global Prime LLP, regulated by the FCA in the United Kingdom

By providing your email and proceeding to create an account on this website, you acknowledge that you will be opening an account with Vantage Global Limited, regulated by the Vanuatu Financial Services Commission (VFSC), and not the UK Financial Conduct Authority (FCA).

    Please tick all to proceed

  • Please tick the checkbox to proceed
  • Please tick the checkbox to proceed
Proceed Please direct me to website operated by Vantage Global Prime LLP, regulated by the FCA in the United Kingdom.

Access Restricted

Your access to this website is restricted.

Our website and services are not available to, and are not intended for, individuals who are citizens or residents of the United States, or entities incorporated in or conducting business within the United States.

If this does not apply to you and you believe you have received this message in error, please contact us at [email protected] for further assistance.

If you fall into any of the above categories, please exit the site.

Important Information

Thank you for visiting the Vantage Markets website. Please note that this website is intended for individuals residing in jurisdictions where accessing it is permitted by Vantage and its affiliated entities do not operate in your home jurisdiction.

By clicking 'I CONFIRM MY INTENTION TO PROCEED AND ENTER THIS WEBSITE', you confirm that you are entering this website solely based on your initiative and not as a result of any specific marketing outreach. You wish to obtain information from this website based on reverse solicitation principles, in accordance with the applicable laws of your home jurisdiction.

I CONFIRM MY INTENTION TO PROCEED AND ENTER THIS WEBSITE

×

Are You Missing Out In the Bull Market?

Trade Now >
Time to Make Your Move?

en

Language

SEARCH

  • All
    Trading
    Platforms
    Academy
    Analysis
    Promotions
    About
  • Search query too short. Please enter a full word or phrase.
  • Search

Keywords

  • Forex Trading
  • Vantage Rewards
  • Trading Fees
  • facebook
  • instagram
  • twitter
  • linkedin
  • youtube
  • tiktok
  • spotify

Michael Burry’s AI Scepticism and SoftBank’s Nvidia Exit: What These Moves Signal About the AI Trade 

In recent weeks, the spotlight in markets has turned to two striking developments: the public scepticism of Michael Burry (of The Big Short fame) toward the Artificial Intelligence (AI) rally, and the reported reduction of a major stake in Nvidia Corporation (NASDAQ: NVDA) by SoftBank Group Corp.  

Together, these moves serve as a useful prism through which we can assess whether the hype around AI is cooling, or at least warranting a more cautious stance from investors and traders. 

Michael Burry – who really became known for his early warnings around subprime mortgages during the Global Financial Crisis (GFC) – has flagged concerns about AI-driven valuations and corporate disclosures.  

Meanwhile SoftBank’s exit (or trimming) of its Nvidia position has sparked questions about institutional timing, profit-taking and the broader sentiment underlying the AI trade. 

In this article, we’ll examine what these two high-profile events could signal for market participants, including those monitoring AI-related market trends in recent years. 

Key Points 

  • Michael Burry’s caution on AI valuations highlights growing concern about stretched assumptions and concentrated positioning in major tech names. 
  • SoftBank’s exit from its Nvidia stake signals a potential shift in institutional sentiment as capital moves from mature AI winners to newer opportunities. 
  • Together, these developments suggest that the AI trade may be entering a phase where market enthusiasm gives way to closer scrutiny of fundamentals and expectations. 

The Context: AI Stocks and Market Euphoria 

The last two years have seen a remarkable run for companies tied to generative AI, high-performance computing and the underlying chip infrastructure that enables large-language models (known as LLMs) and advanced machine-learning applications.  

Firms such as Nvidia, Advanced Micro Devices (AMD) (NASDAQ: AMD) and Super Micro Computer Inc (NASDAQ: SMCI) have surged, driven by investor optimism that we are entering a “new paradigm” of computing. 

Nvidia’s GPUs remain the architecture of choice for many hyperscale data centres; AMD has leveraged its data-centre business to ride that wave; and Super Micro has benefited from increased demand for turnkey systems.  

The overarching market narrative of generative AI applications (chatbots, image generation, enterprise AI), marrying strong chip demand, has unleashed a broad-based rally in tech. Investment funds, both large and small, have piled in. Retail investors have followed suit, often through thematic ETFs or “AI basket” plays. 

Valuations have soared. Multiples once reserved for high-growth software companies migrated into hardware, semiconductors and infrastructure segments. In many cases the belief was that today’s huge capex numbers will underpin revenue growth for years to come, and pricing models were built on that assumption.  

That level of exuberance, when viewed in hindsight of previous technology cycles, raises questions about sustainability. Global funds and retail accounts got heavily concentrated in AI-linked trades throughout 2024–2025.  

Of course, any degree of concentration like this increases vulnerability to shifts in sentiment, regulatory risk or execution disappointments. When too many participants are on one side, the potential for a sharp unwind grows. 

Michael Burry’s Scepticism on AI Valuations 

So, what about Michael Burry? He has earned a reputation as a contrarian investor. His early-2000s bets on sub-prime mortgages in the US and his famous “Big Short” recognition placed him in the narrative of identifying systemic risk early.  

His style has been famously candid and straight to the point; dig into fundamentals, challenge consensus, and look for structural imbalances. 

Recently, Burry has turned his attention to the AI space. He reportedly amassed large put positions against Nvidia and Palantir Technologies. In one report, his fund bought around US$187 million of puts on Nvidia and about US$912 million of puts on Palantir [1].  

Separately, he has publicly criticised large tech companies, including Oracle Corp (NYSE: ORCL) and Meta Platforms Inc (NASDAQ: META), for extending depreciation schedules on AI hardware beyond what he sees as realistic. He has argued that this move amounts to one of the more common “frauds” of the modern era. 

Burry’s reasoning is multi-fold and touches on several key points: 

  • He views current valuations as stretched. When firms are trading at very high multiples based on overly optimistic assumptions, the margin of safety shrinks. 
  • He sees herd behaviour wherever he looks. When many investors assume the same “new paradigm” story, risk is ignored and investors pile in. 
  • He draws parallels to past tech bubbles, where infrastructure investment and hype outpaced revenue fundamentals. 
  • He highlights accounting and execution risk. For example, if AI hardware is being depreciated over five or six years when the technology lifecycle is much shorter (he argues two to three years for upgrades). That mismatch may inflate earnings and make the business appear more profitable than the underlying economics justify. 

For traders and portfolio managers this is a sharp wake-up call: one of the most notable value-seeking investors is pointing to the AI trade as having multiple “bubble elements”.  

Whether one agrees with his timing or not, it challenges the notion that the trade is purely risk-free momentum right now. If someone like Burry is betting against you, it’s worth asking why. 

SoftBank’s Nvidia Stake Sale: A Strategic or Sentiment Shift? 

Meanwhile, SoftBank’s involvement with Nvidia has been significant historically. Through its much-publicised Vision Fund, SoftBank backed many tech ventures, including those centred on AI. Nvidia has clearly been one of the key beneficiaries of the AI infrastructure wave that SoftBank has long championed. 

However, recent filings and commentary show that SoftBank sold its entire roughly US$5.8 billion stake in Nvidia [2]. The sale was disclosed as part of a strategy to raise capital for further investments in AI ventures such as OpenAI.  

SoftBank stressed that the move was not an abandonment of AI but rather a redeployment into other AI-oriented bets. 

At first glance this looks strategic: book profits from a mature winner (Nvidia) and redeploy into emerging opportunities in the AI space. But the size of this stake and the timing matter.  

Nvidia’s valuation were elevated, to say the least, when SoftBank decided to exit. That raises the question: is this simply profit-taking, or does it reflect a shift in internal sentiment regarding where the next phase of AI growth lies? 

In the institutional investor world, when a large player reduces exposure to a thematic that has carried so much of the market’s upside, it can signal two things:  

1) they believe the current asset is “done” or fully valued and;  

2) they may anticipate a change in leadership among winners. That in turn can influence the broader investor base. 

For traders, this may be a noteworthy observation, as large institutional repositioning can sometimes influence liquidity, flows and market sentiment. What started as a small move may cascade like a waterfall if others interpret the signal similarly. 

Reading Between the Lines: What These Moves Signal for AI Stocks 

Taken together, Burry’s public scepticism and SoftBank’s exit from Nvidia serve as caution lights in the broader AI trade. They don’t necessarily mean the AI boom is well and truly over but they do suggest it may be time to have a reality check and “audit your optimism”. 

First, both moves point toward a possible change in sentiment. When contrarians turn cautious and major institutions trim, the crowd’s belief in the narrative becomes less uniform. That can induce rotation away from the strongest winners and into second-tier names or adjacent sectors that have lagged the recent winners. 

Second, we may be entering a period of market normalisation. After a run-up driven by extrapolated growth, valuations will need to be backed up by earnings growth, execution and margin expansion. That’s a tall order as the market continues to place more and more expectation on these big winners.  

In the semiconductor and AI infrastructure realm that means strong end-market demand, manageable cost structures and minimal operational surprises. Any deviation, or even a slight miss, could trigger massive re-ratings. 

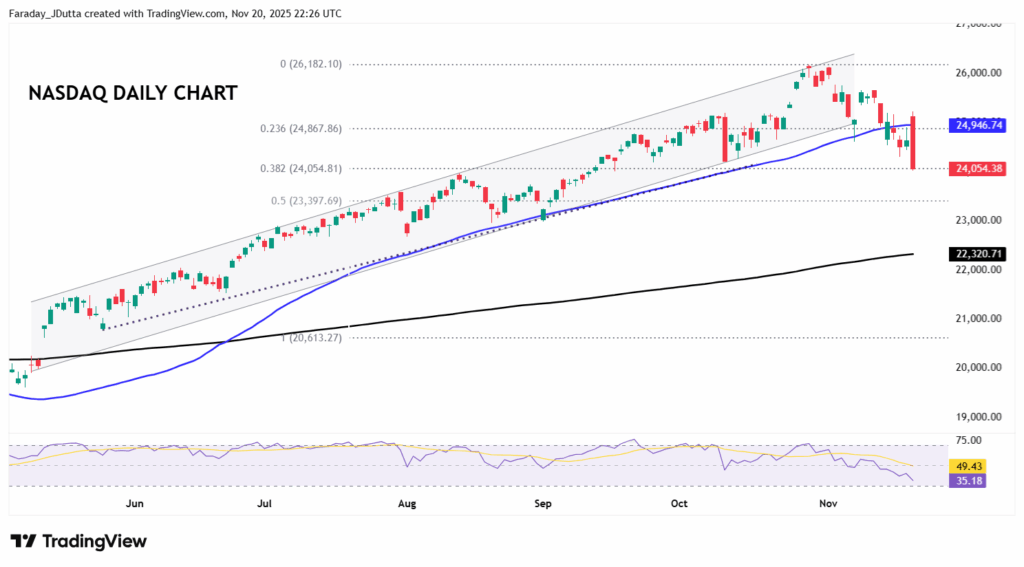
Third, there are implications for broader indices and ETFs. The big tech-focused ETFs, like QQQ (which tracks the Nasdaq 100), and semiconductor-themed ETFs have enjoyed outsized contributions from AI-infrastructure names.  

If that contribution shrinks, the momentum effect may fade. That doesn’t mean the sector collapses; it may just mean the wow factor returns to actual fundamentals rather than just the “story”.  

Some market participants may monitor whether capital rotates from “pure hit” AI infrastructure names toward companies with more modest valuations, steady cash flows, and less crowded positioning. 

Lessons for Traders: Sentiment, Valuations, and Market Cycles 

These recent developments are a good case study in how sentiment and institutional behaviour often precede significant market shifts.  

Here are five key observations framed for those following AI-related markets. 

1. Understand the difference between momentum and value 

The AI trade to date has been heavily momentum-driven. No surprises there. Stocks soared simply because they were “AI plays.” Moving forward, the narrative must be backed by profits (clearly from AI investments), cash flows and sustainable demand. Blindly chasing momentum increases vulnerability to sharp reversals. 

2. Interpret large institutional moves 

When major institutional players reposition, it may indicate their internal risk-reward calculus has changed. As in the SoftBank case, a large exit doesn’t guarantee a crash, but it signals re-examination. Use regulatory filings, reports on positions and public statements to track these behaviours. 

3. Track valuation risk 

When Burry raises concerns about depreciation schedules and possible earnings inflation, he’s calling attention to a hidden valuation risk. Traders must pay attention not just to revenue growth but to who is buying what, at what price and under what assumptions. 

4. Plan for rotation 

As we all know, markets don’t move in straight lines. At some point, the winners of one cycle become the laggards of the next. Traders who are aware of that possibility may choose to monitor for rotation rather than assume current leaders will continue outperforming. If AI infrastructure is one such cycle, what is the next one? Perhaps enterprise AI adoption, industrial AI, or regional AI deployments in Asia? 

5. Diversify exposure and maintain discipline 

Whether you manage trading books or direct investment portfolios, over-concentration in one theme carries higher drawdown risk. Over-investing in AI just because it “feels like the future” is a risk in itself. 

Conclusion: Realism Over Optimism in AI 

The recent signals from Michael Burry’s scepticism and SoftBank’s Nvidia repositioning don’t spell the end of the AI trade.  

On the contrary, the underlying secular thesis of AI remains strong with compelling structural drivers but it does bear remembering that the narrative now needs to be backed up by real profits.  

In that sense, when it comes to assessing the AI trade, investors and traders should both be looking at it through the lens of realism rather than fanciful optimism.  

What these broader moves do signal, however, is caution and that’s a good thing; we may have moved from “growth with momentum” into “growth requiring proof.” 

For traders and investors tracking AI, the message is clear to see: scrutinise valuations, heed institutional signals, be alert to sentiment shifts and avoid being caught in a crowded trade without an exit plan. 

RISK WARNING: CFDs are complex financial instruments and carry a high risk of losing money rapidly due to leverage. You should ensure you fully understand the risks involved and carefully consider whether you can afford to take the high risk of losing your money before trading.             

Disclaimer: References to stocks and indices relate to the underlying market. When trading with Vantage, clients trade CFDs, which do not provide ownership of the underlying assets. The information is provided for educational purposes only and doesn’t take into account your personal objectives, financial circumstances, or needs. It does not constitute investment advice. We encourage you to seek independent advice if necessary. The information has not been prepared in accordance with legal requirements designed to promote the independence of investment research. No representation or warranty is given as to the accuracy or completeness of any information contained within. This material may contain historical or past performance figures and should not be relied on. Furthermore estimates, forward-looking statements, and forecasts cannot be guaranteed. The information on this site and the products and services offered are not intended for distribution to any person in any country or jurisdiction where such distribution or use would be contrary to local law or regulation.         

 Are the Mag 7 Making the Market Fragile? 

If the years between 2023 and 2025 come to be known as the age of Artificial Intelligence (AI), then the Magnificent Seven – Nvidia, Apple, Microsoft, Alphabet, Amazon, Meta, and Tesla – will certainly be labelled the defining force behind it. 

Their rise wasn’t luck. It was built on explosive earnings, relentless innovation, and an AI revolution that reshaped how investors value growth. Together, they became the heartbeat of the S&P 500 Index, powering its gains, but also concentrating its risks. 

The market loves a clear hero, until concentration quietly morphs from tailwind to fault line. Today, a handful of names carry an outsized share of the index’s fate.  

Here, we’ll unpack how concentrated the market has become, what could pressure the Mag 7 next, and how those shocks ripple into the FX and commodities markets. 

Key Points 

  • The Mag 7 now make up a large share of the S&P 500, meaning small setbacks in their performance can sway the entire market. 
  • Their outlook depends on sustained earnings growth, convincing AI returns, and stable policy conditions across global markets. 
  • While their strength drives market leadership, the high concentration also increases fragility when expectations shift or valuations come under pressure. 

The Concentration: Heavy Is the Head That Wears a 35% Crown 

The Mag 7’s dominance has reshaped the market’s DNA. Together, these seven giants now command roughly 35% of the S&P 500’s market cap, with a combined value exceeding US$19 trillion to US$20 trillion at various points this year [1].  

Expand the lens to the top 10 largest companies, and their combined weight jumps to around 42%, marking a record concentration that surpasses even the heights of the Dot-Com bubble.  

That means a modest de-rating in just a few mega-caps can yank the entire index lower, affect liquidity in index-linked derivatives and beta trades, and spark the classic “risk-off” cascade into Treasuries, USD, and gold. 

What was once a broad reflection of the US economy now behaves more like a mega-cap tech and AI barometer. Their weight is backed by earnings power. The Mag 7 are on track to generate roughly one-quarter of total S&P 500 profits in 2025, up from the mid-teens just two years ago.  

Yet, this strength carries risk. With forward P/E ratios above 22x, and even the broader market trading above historical averages, valuations leave little margin for error. When one cluster drives both earnings and sentiment, the index’s resilience fades, and the market’s crown begins to feel heavy indeed [2]

What Could Pressure the Mag 7 Next? 

The Mag 7’s outlook rests on three powerful forces that can each sway market sentiment: the durability of their earnings growth, the realism of AI-driven capital spending and returns, and the stability of policy and geopolitics that shape their global operating environment.  

1. Earnings Growth Durability 

The bull camp argues that growth will stay resilient as AI monetisation accelerates, hyperscaler demand remains red-hot, and these giants continue to out-earn the rest of the S&P 500 given their sheer cash flow-generating power.  

Indeed, several research houses noted that the Mag 7’s earnings in early 2025 far outpaced the so-called “S&P 493.”  

But as these companies grow larger, the focus shifts from how fast they grow to how broad and sustainable that growth is. Guidance cuts, margin compression in AI services, or ad-cycle fatigue in consumer internet could easily trigger multiple contractions.  

Markets that have been conditioned to expect “easy beats” tend to react harshly when those beats stop coming. 

2. AI Capex and the “Show-Me” Phase 

The market has rewarded the Mag 7 for their breathtaking AI capital spending, with hyperscalers pouring tens, soon hundreds, of billions into data centres, chips, and power infrastructure. But 2025 marks a new chapter: investors now want to see the payoff.  

Recent data shows AI-related capex reaching record highs of nearly 60% of operating cash flow, a level even bullish analysts call unsustainable without clear monetisation [3].  

Goldman Sachs has warned that if capex growth cools or normalises toward pre-boom trends, it could shave multiple percentage points off S&P 500 earnings expectations.  

The scale is staggering, as consultancy estimates around US$3.7 trillion to US$7.9 trillion in total AI infrastructure investment this decade, including roughly US$2.8 trillion by 2029 from Big Tech alone. These are extraordinary bets on the future, and the market’s patience will hinge on tangible returns. 

3. Policy, Tariffs, and Geopolitics 

The Mag 7 sits at the crossroads of chips, cloud, advertising, and mobile ecosystems, sectors where regulation and geopolitics often collide. 

Export controls on advanced chips remain a flashpoint. Washington has continued tightening restrictions, while Beijing is reportedly steering state-funded data centres toward domestic AI chips. This dual squeeze complicates Nvidia’s global sales mix and clouds visibility for peers with cross-border dependencies. 

Tariffs and supply-chain nationalism are another wild card. Higher duties on semiconductors, magnets, or batteries extend lead times and strain working capital.  

Studies by the Bank for International Settlements (BIS) and the Centre for Economic Policy Research (CEPR) indicate that the tariff waves of 2025 have disrupted traditional market relationships, with safe-haven flows, bond yields, and currency movements behaving increasingly unpredictably as trade tensions intensify. 

Any stumble across these three levers, whether it’s a growth wobble, an AI capex rethink, or a policy shock, could reset valuations for the very companies that now carry the market’s crown. 

Why a Mag 7 De-Rating Hits Everything (Including CFDs) 

When seven stocks make up roughly 35% of the S&P 500, their every move sends tremors through the entire market. CFDs allow traders to speculate on price movements of these shares without owning the underlying assets. A 10% correction in this basket alone translates to about a 3.5% drag on the index even before factoring in knock-on effects.  

Widen that to the top ten stocks, the weightage becomes around 42%, and the ripple effect becomes tidal. The takeaway is simple: the more concentrated the leadership, the more fragile the index. What used to be diversification could morph into a proxy for seven companies’ quarterly guidance. 

In today’s hyper-leveraged market, traders often gain exposure to these mega-cap names through derivatives, including CFDs. When those leaders gap lower, leverage becomes an avalanche picking up speed. Stop-loss triggers cascade, liquidity evaporates, and market makers widen spreads as volatility spikes.  

Even when the trigger is a single-company issue such as a guidance cut, a regulatory fine, or a delayed product launch, the feedback loop in leveraged products can make it feel systemic. In short, small cracks at the top can look like an earthquake when derivatives magnify the move. 

Cross-Asset “Risk-Off” Domino Effect 

The classic risk-off playbook still applies. When the Mag 7 stumbles, you typically see: 

  • USD strength as capital seeks safety, 
  • Treasury yields dropping as bonds rally, and 
  • Gold prices edging higher as a hedge against uncertainty 

But 2025 has added nuance. Episodes of policy-induced volatility, such as tariffs, export controls, and AI regulation, have sometimes distorted traditional correlations.  

Still, in any Mag 7-driven drawdown that feels macro, expect the familiar pattern: USD (DXY) up, yields down, gold up, and volatility curves steepening across asset classes. 

Spillovers into Forex and Commodities 

These shocks rarely stay confined to equities. Risk-off flows often spill into foreign exchange (forex) and commodities, reshaping behaviour across global markets. 

  • In forex, investors typically retreat to safe havens like the US dollar, Japanese yen, and Swiss franc, while higher-beta currencies such as the Australian dollar, Korean won, and emerging Asian FX tend to weaken. 
  • In commodities, defensive demand boosts gold and silver, while growth-sensitive assets such as oil, copper, and industrial metals can ease on fears of slower global activity. 
  • For energy and materials, this often manifests as a short-term pullback in cyclicals, particularly when a tech-led selloff sparks a wider de-risking of global growth trades. 

The pattern isn’t absolute. So far in 2025, the markets have shown that policy shocks can bend old correlations but the core behavior endures. In moments of stress, liquidity chases safety, not yield. 

The Bull Case You Can’t Ignore, and Why It Still Carries Risk 

Credit has to be given where it’s due. The “Magnificent Seven” have earned their leading role over the years, and their slice of the S&P 500’s profits surged thanks to disciplined execution and AI-driven productivity leaps. Wall Street believes the rally we’ve witnessed isn’t mere hype.  

It is structural, underpinned by powerful, long-term forces driving the modern economy such as cloud computing, digital advertising, and the rapid commercialisation of AI.  

These aren’t passing trends. They’re the foundations of a new growth cycle reshaping how businesses operate and generate value.  

With fortress-like balance sheets, these companies can absorb heavy capex and still outgrow their rivals. If AI spending converts reliably into revenue and margin uplift, then the extreme index concentration may reflect genuine economic efficiency rather than a speculative bubble.  

Still, even the bulls admit the “show-me” moment is ahead. When you’re so big in size and rich in valuation, the bar for “proof-of-concept” rises. Every earnings release becomes another test of resilience and enhanced growth expectations.  

Cloud divisions must show accelerating adoption, ad platforms need to keep delivering measurable Return on Investment (ROI), and chipmakers must push silicon boundaries without margin erosion.  

If any of those gears whine or stall, the same concentration that helped fuel the ascent could turn into a structural liability, amplifying downside risk. 

In short, the dominance of the Mag 7 is both the market’s greatest engine and its most precarious hinge. A golden crown in the making until the next earnings miss makes the weight too heavy to bear. 

From Catalysts to Consequences: How the Mag 7 Narrative Can Flip 

Over the next few quarters, investors will be watching a handful of critical catalysts that could determine whether the Mag 7’s dominance remains a feature or becomes a fault line.  

The story isn’t just about valuations. It is about how guidance, policy, and market breadth interact to shape sentiment across equities, FX, and commodities. 

Key Catalysts to Watch: 

  1. AI Capex Guidance: The next wave of AI spending plans will be pivotal. Are 2026 capex budgets re-accelerating or starting to normalise? Any hint of a slowdown could dampen enthusiasm for data-centre suppliers and temper broader AI sentiment. 
  2. Chip Export Headlines: Further tightening of advanced-chip export rules or reciprocal actions from China could disrupt the earnings mix for semiconductor leaders and ripple through the AI value chain. 
  3. Earnings Breadth vs. Depth: Keep an eye on whether non-Mag 7 earnings start pulling more weight. Broader participation cushions the market against shocks while lagging breadth, on the other hand, could heighten fragility.  
  4. Rates & Dollar Path: A higher-for-longer Fed or a stronger US dollar typically pressures long-duration growth equities, curbs global risk appetite, and channels outflows from emerging markets. 

Each of these factors can independently shift market psychology, but together, they can redefine the rhythm of the rally. 

Leadership vs. Risk: The Dual Reality 

Two truths define today’s market. First, the Mag 7’s leadership is earned, not accidental. These companies built the digital and AI infrastructure that underpins modern productivity, from cloud computing and semiconductors to search, ads, and consumer ecosystems.  

Their profit engines remain unmatched, and their earnings growth continues to justify their commanding scale. In many ways, they are the economy’s new “core infrastructure,” where innovation and profitability meet. 

But the second truth is harder to ignore: leadership has become unbelievably concentrated. When a handful of names dominate both index weight and earnings contribution, the market’s shock absorbers get thinner.  

A modest stumble, whether a margin squeeze, a policy headline, or slower guidance, can trigger outsized index-level volatility. The mathematics of concentration turns strength into fragility. 

Valuations magnify this tension. The S&P 500 Index now trades above long-term averages, while the Mag 7’s forward PE multiples stretch beyond the market’s historical norms.  

As Warren Buffett famously said, “Price is what you pay; value is what you get.” When optimism lifts prices faster than earnings can catch up, even world-class businesses risk short-term overvaluation. 

Conclusion: Magnificent But Not Invincible 

The Mag 7 are undoubtedly the engines of the AI era but even engines overheat when pushed too hard. Their dominance is real, their earnings are proven, and their innovation unmatched.  

Yet, when seven companies hold a third of the overall market’s weight, leadership and fragility become inseparable. Valuations are rich, expectations are sky-high, and investors are now demanding proof that the enormous amount of AI investment will soon result in corresponding profits. 

The challenge isn’t betting against greatness. It is remembering that even the strongest stories need balance sheets, and not fairy tales, to stay magnificent. 

RISK WARNING: CFDs are complex financial instruments and carry a high risk of losing money rapidly due to leverage. You should ensure you fully understand the risks involved and carefully consider whether you can afford to take the high risk of losing your money before trading.             

Disclaimer: References to stocks and indices relate to the underlying market. When trading with Vantage, clients trade CFDs, which do not provide ownership of the underlying assets. The information is provided for educational purposes only and doesn’t take into account your personal objectives, financial circumstances, or needs. It does not constitute investment advice. We encourage you to seek independent advice if necessary. The information has not been prepared in accordance with legal requirements designed to promote the independence of investment research. No representation or warranty is given as to the accuracy or completeness of any information contained within. This material may contain historical or past performance figures and should not be relied on. Furthermore estimates, forward-looking statements, and forecasts cannot be guaranteed. The information on this site and the products and services offered are not intended for distribution to any person in any country or jurisdiction where such distribution or use would be contrary to local law or regulation.         

Huge stock turnaround as NVDA post-earnings gains faded

* Wall Street indexes end lower after sharp reversal, tech leads drop

* Nvidia closed lower after strong results, Walmart holds higher

* Bitcoin slides below $87,000, down 30% from all-time high

* Fed officials showing caution, even as some call for December rate cut

FX: USD printed a doji candle denoting some indecision after it pierced the 200-day SMA at 99.91. This had capped the upside earlier in the month at 100.36. We got a mixed September NFP report with a big beat on the headline but 33k of downward revisions over the previous two months. The unemployment rate also ticked higher than expected at 4.4% while wage growth came in one-tenth below estimates at 0.2%. All in all, a mixed data set amid much uncertainty about the economy amid the shutdown and reopening. Key now is the fact we don’t get any more major labour market figures until after the December FOMC meeting. The odds of a 25bps rate cut sit at 40% now, up from 30% before the NFP release.

EUR turned lower for a fifth day in a row and touched a minor Fib level (23.6%) of this year’s rally at 1.1507. Focus is on today’s PMIs with little other major data being seen recently. The ECB is neutral in its outlook, which has been clearly communicated.

GBP was the leading major as it gained versus the dollar and traded around the 50-week SMA at 1.3124. Budget speculation continues as the 10-year Gilt yield stabilised around 4.6% after its sharp move higher on Wednesday up to the 200-day SMA.

JPY weakened again as the major hit fresh multi-month highs above 157.50. The year-to-date January top is at 158.87. PM Takaichi’s fiscal plans are seeing BoJ near-term rate hike bets pared, while expectations of tightening in the new year pick up. The yen reclaimed some losses as risk sentiment turned red. There was more verbal intervention overnight but it had little impact.

US stocks: The S&P 500 lost 1.56%, closing at 6,539. The Nasdaq moved lower by 2.38% to finish at 24,045. The Dow settled down 0.84% at 45,752. Tech and Consumer Discretionary led the losers, down 2.66% and 1.73% respectively with Consumer Staples the only sector in the green, up 1.11%. Walmart jumped 6.5% on the day after it saw EPS, revenue and comparable sales all beat, while it bumped up its outlook ahead of the holiday season. It also said it was moving its listing to the Nasdaq, after 55 years on the NYSE. Of course, Nvidia was the major story initially up 6%, before the turnaround after the open and closing 3.2% lower. It beat and raised guidance with demand and supply stellar, but the risk-off mood hit tech hard with no fresh driver. There had been commentary in yesterday’s FOMC minutes about risks of equity downside and AI valuations are a concern still, while NVDA client concentration risk remains high.

Asian stocks: Futures are mixed. Stocks jumped helped by NVDA’s perceived solid earnings and guidance which buoyed tech stocks. The ASX 200 was supported by tech and gold. The Nikkei 225 surged above 50k but gave back gains amid ongoing Japan-China tensions and as Japanese government bond yields continued to move north. The Hang Seng and Shanghai Composite were bid though the mainland lagged its peers amid the US-China AI race.

Gold traded around the major Fib retracement level (38.2%) of the early September break to the record high in November at $4,044. The precious metal was relatively quiet, printing a doji candle and not picking up any safe haven bids as the risk rally turned lower.

Day Ahead – PMIs

This data typically serves as a leading indicator with survey figures preceding hard data. That said, the soft surveys in recent months haven’t always been seen in activity data releases. Eurozone services PMI should likely bolster the composite print in region, with manufacturing expected to stabilise around the neutral 50 mark. But there’s recently been a series of disappointing hard data with weak industrial production and retail sales signalling an ongoing soft backdrop. It seems that global headwinds still linger over Germany in the form of China’s muted growth and US tariffs. Country wise, France lags, Italy and Germany are soft while Spain is the standout performer.

UK PMIs may be clouded by budget uncertainty again, after worse than expected metrics in September. Consensus expects lower figures with Services and the Composite printing in the high 51s and manufacturing still in contraction at 49.1. With so much focus on next week’s Budget, the figures could add to the downbeat mood in the UK or be looked through as markets await that major risk event.   

Chart of the Day – Nasdaq prints huge bearish engulfing candle

With Nvidia’s weighting around 10% in the tech-heavy Nasdaq, it’s no surprise that its earnings would have a huge influence on where the index goes, as we have stated previously. Prices have fallen close to  8% from the record high print at 28,182 from late October, and out of the bull channel seen since mid-May. This series of higher highs and higher lows was also supported by the 50-day SMA which has been broken recently. That currently sits at 24,946. Yesterday’s intraday price action looks bearish with the gap higher on the open quickly being filled and the index falling sharply. That has seen a big bearish engulfing candle print, with a major Fib retracement level (38.2%) of the May to October rally at 24,054. The midpoint of that move sits at 23,397.

Short Selling Stock: How to Short Sell in 2026

Short selling stocks has evolved from a niche tactic used by hedge funds into a mainstream strategy that is now accessible to everyday traders. In 2026, platforms and tools have made it easier than ever to explore opportunities in market downturns, though these opportunities also come with higher risk. 

If you have ever watched the movie The Big Short, you have seen short selling play out on a cinematic scale. The movie follows a few investors who ‘shorted’ the US housing market before the 2008 crash, positioning billions against what everyone else thought was unshakable. They were not just lucky—they understood that prices do not always go up forever. 

Short selling stocks lets you take a similar stance by speculating that a stock, index, or market will decline in value. Whether traders are hedging their portfolios or capitalising on overhyped trends, mastering the short side of the market might make one a more well-rounded trader. 

Let’s break down how short selling stocks works today, the methods available, and how to approach it—without biting off more risk than you can chew.  

Key Points 

  • Short selling stocks lets traders profit when markets fall, offering flexibility beyond traditional buy-and-hold strategies. 
  • Many traders and investors see short selling stocks as a method to potentially balance portfolios and manage risk during volatile or declining market conditions. 
  • Success depends on timing, discipline, and risk control, since losses can escalate quickly.  

What Does Short Selling Stocks Mean Today?  

In essence, short selling stocks involves seeking potential returns when prices fall. You borrow an asset (stock), sell it now, and buy it back later at a lower price. Think of it like this: 

You borrow your friend’s concert ticket and sell it for $500 today, hoping demand drops. A week later, prices fall to $300—you repurchase it, return the ticket, and keep $200 as your return. But if the ticket prices rise to $800, you will have to repurchase it at a loss. 

Traders short sell stocks for three main reasons: 

  • Speculation: Betting that an overhyped stock will fall  
  • Hedging: Offsetting losses from other long positions  
  • Market-Neutral Strategies: Balancing longs and shorts to gain potential returns from relative performance  

Do note that shorting is not limited to stocks. Today, traders can also take short positions in exchange-traded funds (ETFs), indices, or derivatives like CFDs and futures—each offering different risk profiles and capital requirements. The key is knowing which method fits your goals and experience level.  

This article will focus on short selling stocks, so keep reading to find out more.  

3 Methods of Shorting Stocks 

There is more than one way to “go short”. Each method suits different levels of experience and capital: 

1. Traditional Shorting (Borrow & Sell) 

This is the classic method used by institutional traders. You borrow shares from your broker, sell them in the open market, and buy them back later to return them. 

  • Why Consider It: Direct exposure to the stock’s downside. 
  • Downside: Requires a margin account, borrowing fees, and you are liable for dividends paid during the short position. 
  • Example: You short 100 shares of Company A at $50. The price drops to $40—you buy back, realising a $1,000 return (minus fees). 

2. Using Derivatives (CFDs, Futures, Swaps) 

With stock CFDs (contracts for difference), it allows traders and investors to trade price movements without owning or borrowing the actual stock. 

  • Why It Is More Accessible: CFDs are leveraged products that allow traders to speculate on price movements without owning the underlying asset. 
  • Extra Flexibility: You can apply leverage (trade larger positions with smaller capital). 
  • Example: If a stock falls from $100 to $90, a CFD short earns you the $10 difference, multiplied by your position size. 
  • Risks: Leverage magnifies both potential returns and losses. 

Meanwhile, futures and swaps are often used by professional traders. Futures let you lock in a price to sell in the future, while swaps (like those used in The Big Short) are contracts with financial institutions that pay off based on the fall in value of an underlying asset.  

3. Short Stocks via Inverse ETFs 

Inverse ETFs can act as ‘set-and-monitor’ tools for those who prefer simplicity. These funds move opposite to their benchmark—if the S&P 500 drops 1%, an inverse S&P ETF rises roughly 1%. 

  • Why Consider It: No margin, no borrowing, and you can buy them like a regular stock. 
  • Downside: They are designed for short-term trading, not long-term holding, because of daily rebalancing.  
  • Example: Buying an inverse ETF before a market downturn may offset losses in a broader portfolio. 

Related Article: 5 Best ETF Trading Strategies For Traders to Consider  

How to Short Sell Stocks: Step-by-Step Execution  

Short selling stocks may sound intimidating, but breaking it down helps.  

Step 1: Screen for Short Candidates

Look for warning signs such as high debt, slowing growth, inflated valuations, or heavy insider selling. Tools such as TradingView or Finviz can flag potential overbought stocks. 

Step 2: Calculate Costs and Margin 

A stock with high “short interest” (percentage of shares sold short) might be overextended, but also prone to a squeeze. Check borrow fees, as popular short-term targets often cost more to maintain. 

Step 3: Plan Entry and Exit 

Short positions require precise timing. Identify catalysts like earnings reports, economic data, or sector trends that could trigger a reversal in a stock’s price. Plan both the target level and exit point before entering—remember, discipline matters more than luck when prices move fast.  

Step 4: Monitor Constantly 

Stock prices can fluctuate rapidly, so watch for sudden reversals or news that could trigger a short squeeze. Regularly review data resources and world events—if the reasons for shorting change, be ready to close out positions early rather than wait for confirmation. 

Step 5: Use Stop Losses and Risk Controls 

A small rally can snowball into big losses. Always consider risk management techniques such as defining maximum losses upfront and automating exits. 

2 Case Studies from Recent Years 

Short selling stocks has played a defining role in some of the most dramatic market events of the past decade. From retail-fuelled rallies to corporate controversies, these real-world stories reveal both the risk and reward that come with betting against the crowd.  

Example 1: GameStop and the Meme Stock Squeeze (2021)¹ 

GameStop was meant to be a classic short setup—a struggling video game retailer facing digital disruption and declining sales. By late 2020, hedge funds had built substantial short positions, betting the company’s stock would continue to fall. At its peak, short interest exceeded 140% of available shares, meaning more stock was borrowed and sold short than actually existed.  

This created the conditions for a short squeeze. 

Cue early 2021, where thousands of retail traders on Reddit’s r/WallStreetBets forum noticed the imbalance. Framing it as a battle between “the little guys” and Wall Street, they began buying shares and call options at scale. The surge in demand forced short sellers to repurchase shares to limit losses, causing a chain reaction known as a short squeeze. 

Within two weeks, GameStop’s stock skyrocketed from around $20 to an intraday high of $483, a gain of over 1,700%, while some hedge funds reportedly lost over $10 billion. Trading platforms like Robinhood temporarily restricted buying due to volatility, intensifying the uproar. 

The event underscored how collective sentiment, online coordination, and option activity can overpower traditional market logic. For traders, it was a reminder that short selling—though potentially lucrative—carries unlimited risk when sentiment turns irrational. 

Lesson: In today’s markets, fundamentals alone do not tell the full story. These examples are for educational purposes and illustrate the risks and dynamics of market sentiment

Example 2: Wirecard—When Short Sellers Were Right (2020)² 

Unlike GameStop, Wirecard was not a frenzy—it was a slow, methodical unmasking. Founded in 1999, Wirecard grew into Germany’s leading fintech corporation by 2005, offering global payment processing across Europe and Asia. By 2018, it had joined the elite DAX 30 index, valued at over €24 billion, a symbol of Europe’s tech ambitions. 

But beneath the surface, short sellers and journalists—notably at the Financial Times—had been sounding alarms since 2015. Reports, such as the Zatarra Report, alleged Wirecard laundered money and conducted fraudulent transactions. Each time, Wirecard denied everything, regulators sided with the company, and even banned short selling to ‘protect’ investors3. Yet the sceptics persisted, betting that the numbers did not add up. 

Their conviction paid off. In June 2020, auditors from EY revealed a €1.9 billion hole in Wirecard’s accounts—money that simply did not exist. Within days, the stock collapsed by more than 90%, erasing billions in market value. The CEO was arrested, and Germany’s top regulator faced global scrutiny for ignoring early warnings. 

Lesson for traders: Wirecard showed that short selling is not just speculation—it can expose structural frauds and protect markets from overvaluation. But it also highlights the patience, deep research, and conviction needed to go against the crowd. Well-researched shorts can be powerful when they are grounded in facts, not hype. 

What Are the Risks of a Short Sale—and How to Mitigate Them?  

Short selling stocks can be powerful, but the risk-reward curve is inverted. 

  • When you buy (go long), your potential loss is limited—a stock cannot fall below zero. 
  • When you short stocks, your loss is theoretically infinite as share prices can rise indefinitely.  

That is why understanding asymmetric risk is crucial. 

Other pitfalls include: 

  • Short Squeeze: When heavily shorted stocks surge sharply—like GameStop in 2021—short sellers may rush to buy back shares, driving prices even higher and forcing painful losses in a feedback loop. 
  • Liquidity Risk: Some stocks are hard to borrow, and brokers may recall your borrowed shares at any time. If that happens while prices are rising, you are forced to buy back at a higher price, potentially realising a loss before your trade thesis unfolds. 
  • Dividends & Fees: You are responsible for paying dividends owed to the lender along with daily borrowing fees that add up over time, turning a potentially winning position into a losing one if held for too long. 
  • Regulatory Risks: Authorities can impose temporary short-sale bans during crises or volatility spikes. These restrictions can ‘trap’ open positions, preventing exit or adjustment until the ban is lifted.  
  • Corporate Pushback: Companies can fight back by announcing stock buybacks, positive guidance, or PR campaigns to restore investor confidence. This can trigger a price rally that squeezes shorts and invalidates your bearish setup. 

Each of these pitfalls shows the asymmetric nature of short selling, where potential gains are limited while losses can, in theory, be unlimited. 

More importantly, success depends on timing and disciplined risk management qualities that separate disciplined traders from speculative participants. Avoid shorting on hype. Use stop orders, manage leverage carefully, and focus on liquid, high-volume assets. 

Related Article: 3 Types of Stock Market Orders Every Investor Should Know  

4 Tools & Resources for Short Sellers 

The effectiveness of short selling stocks comes from information and timing. The following platforms and tools can help traders identify opportunities, manage risk, and act decisively. 

  1. TradingView: Great for screening overbought stocks or identifying bearish chart patterns. TradingView’s alerts and community sentiment tools can assist in refining entry and exit timing. 
  2. Vantage Markets: Offers access to multi-asset data and CFDs, enabling traders to speculate on both rising and falling markets from a single interface. Availability of instruments may vary depending on the trader’s jurisdiction and account type.  
  3. Ortex: Provides real-time data on short interest, borrow fees, and utilisation rates, which helps traders gauge when a stock is overcrowded or at risk of a short squeeze—essential for timing exits and avoiding losses. 
  4. Demo Accounts: Perfect for testing short strategies before using real funds. Use them to simulate different market conditions and learn position sizing.  

Interested in short selling via stock CFDs? Consider opening a Live Account with Vantage today to explore market opportunities.  

What Can Traders Learn from Short Selling?  

Short selling stocks is both a skill and a discipline. It sharpens a trader’s understanding of the markets, general sentiment, and stock valuation. However, it is also one of the higher-risk strategies to execute without preparation. 

When stock traders go long, their potential returns are unlimited, but their losses are capped at 100%. When traders go short, it is the opposite: The gains cap at 100%, but losses can exceed that indefinitely. 

So, why is short selling stocks still so popular? Because when done right, this trading strategy can hedge a portfolio and identify overvaluation. However, it requires discipline, risk awareness, and a clear plan for managing adverse moves. 

Always respect the risk by beginning with small positions and practising with demo accounts. Experienced traders understand that knowing when to not short is just as important as knowing when to act.  

Related Article: What is Short Selling (Shorting) and How Does It Work Exactly?  

Short Selling Stocks FAQs  

1. What is short selling stocks? 

It is the act of selling borrowed shares and expecting the price to drop so that traders can repurchase them at a lower price later. 

2. How do you short sell a stock? 

Traders can short stocks through their broker (borrow & sell), or use instruments like CFDs, futures, and inverse ETFs to gain short exposure. 

3. How do you manage risk when shorting stocks? 

Stock traders should always use stop losses, maintain appropriate position size, and avoid hype-driven or illiquid stocks. Remember: The market can remain unpredictable longer than a trader can sustain losses. 

4. Why short sell stocks instead of just trading long positions? 

Some traders prefer short selling because they see opportunity where others see risk. When markets look overconfident or a stock seems overpriced, shorting becomes a way to challenge the crowd, to profit when sentiment flips or valuations correct.  

Strategically, short selling can also potentially help balance portfolios and reduce exposure when markets feel overheated. 

5. If short selling stocks has unlimited risk, why do traders still do it? 

Experienced traders use short selling as part of broader portfolio management, not as speculative bets. With stop losses and leverage control, it can be tapped on as a tool for diversification or hedging during downturns.  

6. Can beginners try short selling? 

Before shorting stocks, beginners should first develop a thorough understanding of short selling and its risks. Practicing with demo accounts can help build familiarity before considering live trading.

RISK WARNING: CFDs are complex financial instruments and carry a high risk of losing money rapidly due to leverage. You should ensure you fully understand the risks involved and carefully consider whether you can afford to take the high risk of losing your money before trading.             

Disclaimer: References to stocks and indices relate to the underlying market. When trading with Vantage, clients trade CFDs, which do not provide ownership of the underlying assets. The information is provided for educational purposes only and doesn’t take into account your personal objectives, financial circumstances, or needs. It does not constitute investment advice. We encourage you to seek independent advice if necessary. The information has not been prepared in accordance with legal requirements designed to promote the independence of investment research. No representation or warranty is given as to the accuracy or completeness of any information contained within. This material may contain historical or past performance figures and should not be relied on. Furthermore estimates, forward-looking statements, and forecasts cannot be guaranteed. The information on this site and the products and services offered are not intended for distribution to any person in any country or jurisdiction where such distribution or use would be contrary to local law or regulation.         

Indices Dividends For Period Of 19 to 27 November 2025

Here are the share CFD dividends that will be paid out from 19 November 2025:

Instruments19 Nov 202520 Nov 202521 Nov 202524 Nov 202525 Nov 202526 Nov 202527 Nov 2025
DJ30 (USD)0.0005.60314.6530.0008.00414.1600.000
SPI200 (AUD)0.0000.0000.5030.0001.2480.4910.598
HK50 (HKD)0.0000.0000.0000.0000.0000.0002.919
Nikkei225 (JPN)0.0000.0000.0000.0000.0000.0000.000
SP500 (USD)0.2190.9320.5060.0900.4460.3770.000
UK100 (GBP)0.0005.2240.0000.0000.0001.7373.642
NAS100 (USD)0.1774.4881.6970.3250.1091.5200.000
EU50 (EUR)0.0000.0000.0007.5770.0000.0000.000
FRA40 (EUR)0.0000.0000.0002.1140.0000.0000.000
ES35 (EUR)0.0000.0000.0000.0000.0000.0000.000
CHINA50(USD)0.0002.0561.8720.0000.0000.0000.000
US2000(USD)0.0170.0590.1450.1170.0600.0600.000
SA40(ZAR)0.0000.0000.0000.0000.0000.0000.000
SGP20(SGD)0.0000.6020.0620.0000.0000.0000.000
TWINDEX(USD)0.0000.0000.0000.0000.0000.0000.000
HKTECH(HKD)0.0000.0000.0000.0000.0000.0002.739
CHINAH(HKD)0.0000.0000.0000.0000.0000.0000.000
IND50(USD)0.0000.0000.0000.0000.0000.0000.000
SWI20(CHF)0.0000.0000.0000.0000.0000.0000.000
NETH25(EUR)0.0000.0000.0000.0000.0000.0000.000

Nvidia posts booming revenue and positive guidance

* US stocks close slightly higher with Nvidia on deck

* Dollar surges to two-week high, extended vs yen ahead of NFP

* Gold choppy and trims gains after FOMC minutes

* NVDA quiets investor fears with upbeat guidance, stock futures up

FX: USD broke higher and hit the 200-day SMA at 100.29. This capped the upside earlier in the month at 100.36. Rate cut expectations were pared back after the BLS schedule showed that the Fed won’t see the November or October US jobs data before the December FOMC meeting. Money markets predict a one in three chance now of a 25bps rate reduction, versus a 50:50 chance on Tuesday. The FOMC minutes added little new but emphasised how divided the committee is. The greenback was modestly bid on the release as ‘many’ officials were expecting no change in December.

EUR turned lower for a fourth day in a row but outperformed its peers. A minor Fib level (23.6%) of this year’s rally is 1.1507. Final euro area inflation figures printed in line with estimates, with the headline holding steady at 2.1% y/y and core at 2.4% y/y. The data didn’t change the outlook for euro area interest rates. Markets still price no material change in the ECB’s policy settings through to Autumn 2026.

GBP was mid pack among the majors again after inflation data revealed that food price pressures were strong and services CPI rose after volatile items are stripped out. But many economists believe UK inflation has peaked and markets still price in a high chance of a December BoE rate cut. The November multi-month lows sit at 1.3010.

JPY was a major underperformer again as USD/JPY rose to levels last seen in mid-January. Concerns mounted about the BoJ’s independence and its implications on the outlook for relative central bank policy following comments from Finance Minister Katayama who stated an intention to adjust the BoJ/government accord. These was also some speculation that the BoJ is unlikely to raise rates before March. JGB yields had hit multi-year highs overnight on fears the new stimulus fiscal package will strain already weak public finances.

US stocks: The S&P 500 added 0.38%, closing at 6,642. The Nasdaq moved higher by 0.56% to finish at 24,641. The Dow settled up 0.1% at 46,139. Tech, Communication Services, Materials and Financials led the gainers with Energy the notable laggard. News of a proposed peace plan by the US to end the Ukraine/Russia war hit the latter sector and crude. Communications were boosted by fresh all time highs in Alphabet on positive reviews of the new Gemini 3. This came on the back of Berkshire Hathaway and Warren Buffet’s switch into Google’s parent and out of Apple. Three big retailers (TGT, LOW and TJX) reported earnings with mixed results. Only TJX closed higher after giving strong full year guidance. Target trimmed the top end of its full-year profit range and closed 2.8% lower. Nvidia forecast Q4 revenues above estimates – $65bn vs $61.66bn and adjusted gross margins above expectations. The stock rose 4% in extended trading, with US futures also trading positively.

Asian stocks: Futures are mixed. Stocks were cautious ahead of big risk events ahead. The ASX 200 was supported by gold miner gains, but limited news flow saw prices settle virtually unchanged. The Nikkei 225 dipped again in choppy trade amid ongoing China-Japan tensions and PM Takaichi’s fiscal package. The Hang Seng and Shanghai Composite was muted after initial gains with Hong Kong conforming to global tech losses.

Gold sold off through the US session, having climbed over 1% higher earlier in the day. The dollar got increasingly bid as Treasury yields eventually turned higher on the BLS news. A major Fib retracement level (38.2%) of the early September break to the record high in November sits at $4,044.

Day Ahead – US Non-Farm Payrolls, Japan CPI

Consensus estimates of the delayed September US employment data are for the headline to add 50k jobs, with an unemployment rate steady at 4.3% and average hourly earnings at 0.3% m/m and 3.7% y/y. Alternative labour market data have painted a mixed picture with jobs growth sluggish but not falling off a cliff. An inline print might be seen as a ‘Goldilocks’ report – not too hot to ignite inflation fears and not too cold that growth fears increase.

October nationwide Japan inflation is expected to accelerate driven by broad-based goods and services price gains. Tokyo CPI has been hot in recent months, and this could cause the 30% chance of a December BoJ interest rate hike to increase.

Chart of the Day – Dollar upside move through the 200-day SMA

The greenback has enjoyed four consecutive days of buying after the Dollar Index found support at the upward trendline from the late September low last week. A very strong NFP report may push the Fed to the sidelines and see more dollar strength. The 200-day SMA sits at 99.95 with next resistance at the November and August tops at 100.36/25. Very soft NFP could spark recession or stagflation fears and cause the buck to get sold as Fed rate cut bets increase. Support sits at that upward trendline and the long-term July low from 2023 around 99.57.