


Crude Oil Price Today: Falls Below $72 as OPEC+ Raises Output for August

Vantage Editorial Team >
Vantage Editorial Team >
Vantage is a global, multi-asset broker with a team of in-house writers and market analysts who produce educational and insightful trading content for traders of all levels.
 Updated Tue, 2026 July 7 03:52

The Brent crude oil price traded near $72.15 a barrel and the WTI crude oil price held near $69.14, as of 01:50 UTC (09:50, GMT+8) on 7 July 2026. Both crude oil prices have remained under sustained selling pressure for most of the past six weeks, with Brent last week trading at levels not seen since late February.
In the latest crude oil news, seven OPEC+ members agreed on 5 July 2026 to accelerate the rollback of voluntary production cuts by a combined 188,000 barrels a day from August 2026, the fifth consecutive monthly increase since April 2026. It comes alongside signs that shipping through the Strait of Hormuz continues to normalise, easing the disruption that had pushed oil prices sharply higher during the recent Middle East conflict.
This piece covers the Brent oil and WTI crude oil price chart, the supply and demand backdrop, and the levels traders are watching. Prices are indicative and for informational purposes only. This is not financial advice.
Key points
- Crude oil prices fell again this week: Brent near $72.15 a barrel and WTI near $69.14 as of the cut-off for this analysis, extending a multi-week decline after OPEC+ approved another output increase.
- OPEC+ agreed on 5 July 2026 to accelerate the rollback of voluntary output cuts by 188,000 barrels a day from August 2026, the fifth consecutive monthly increase since April, while shipping through the Strait of Hormuz continues to normalise.
- US commercial crude inventories fell by 3.8 million barrels in the week to 26 June 2026, according to the US Energy Information Administration, yet the drawdown has done little to slow the broader decline in the crude oil price.
The oil price chart: what Brent and WTI are showing
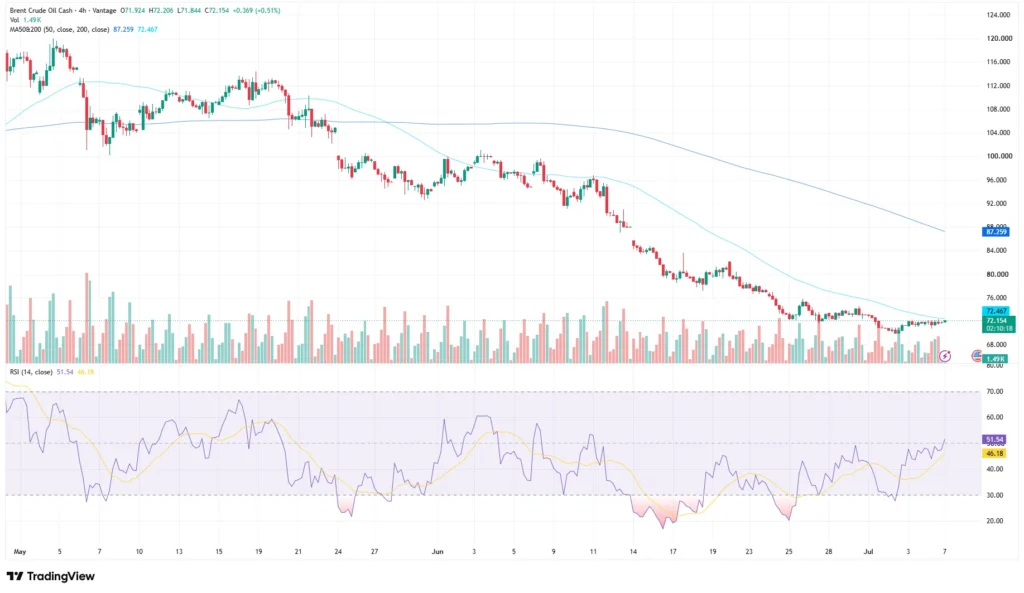
On the 4-hour Brent oil price chart, Brent (UKOUSD) last traded at 72.154, up 0.369 (+0.51%) from the prior session, after opening at 71.924 and ranging between 71.844 and 72.206, according to the Vantage UKOUSD CFD feed. The pair sits just below its 200-period moving average of 72.467, while the 50-period average has drifted down to 87.259, still well above the current price after the sharp decline since May. RSI on the TradingView setup used for this analysis reads 51.54, roughly in the middle of its range.
WTI (USOUSD) shows a similar picture on its own oil price chart. The pair last traded at 69.138, up 0.280 (+0.41%), after opening at 68.921 and trading between 68.841 and 69.188, per the Vantage USOUSD CFD feed. Its 200-period moving average sits at 69.870, just above the current price, while the 50-period average is at 83.941. RSI reads 45.17, a touch below the midline.
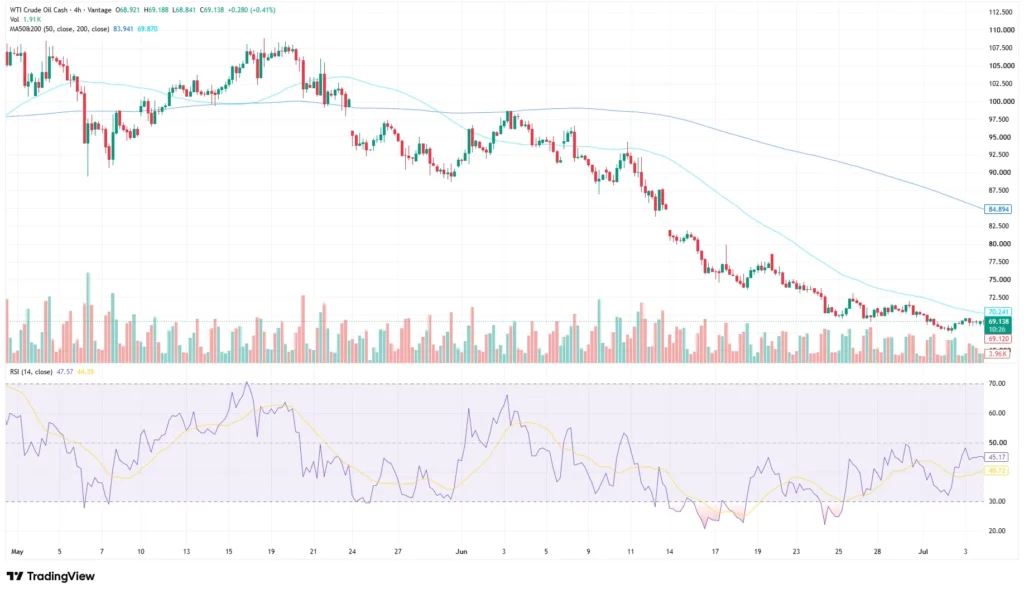
Both charts tell a similar story: a steady decline since May 2026 rather than a single sharp break, with price sitting close to its shorter-term average and well below the longer one. Neither RSI reading is at an extreme, consistent with a persistent bearish trend.
Why crude oil prices have slipped below their post-conflict range

OPEC+ keeps adding barrels
Seven OPEC+ members (Saudi Arabia, Russia, Iraq, Kuwait, Kazakhstan, Algeria, and Oman) agreed on 5 July 2026 to accelerate the rollback of their voluntary production cuts by a combined 188,000 barrels a day beginning in August[1]. Saudi Arabia and Russia will each add 62,000 bpd, with smaller increases from the other five producers[2]. It is the fifth consecutive monthly increase since the unwinding began in April, taking the cumulative rollback of voluntary production cuts further forward since then.
OPEC+ has said it can raise, pause, or reverse the phase-out of its voluntary cuts, and its next meeting is scheduled for 2 August[2]. Barclays has pointed to a Brent forecast of around $69 a barrel for the third quarter, based on an assumption that the normalisation in Strait of Hormuz flows continues[3].
Shipping through the Strait of Hormuz continues to normalise
A memorandum of understanding signed between the US and Iran on 17 June committed both sides to removing obstacles to maritime traffic through the Strait of Hormuz while wider talks on the Middle East conflict continue[4]. The International Energy Agency’s latest Oil Market Report noted that flows through the strait had already climbed from a May low of around 9.6 million barrels a day to close to 12 million barrels a day, helped by ship-to-ship transfers in the Gulf of Oman[5].
Saudi Arabia’s crude exports have moved back toward pre-conflict levels, and the United Arab Emirates, which exited the OPEC+ production quota framework during the Middle East conflict, has also restored its shipping flows[6], although occasional security-related routing changes continue to occur, with several vessels reportedly making unexplained U-turns and detours in the strait in recent days[6]. Flows have improved, but operational risks remain. Mediators from Qatar and Pakistan have also been holding talks between US and Iranian officials in Doha, which US President Donald Trump described as progressing well[7].
The demand and inventory picture
On the demand side, US commercial crude oil inventories fell by 3.8 million barrels in the week to 26 June 2026, to 408.4 million barrels, about 7% below the five-year average for the season, according to the EIA’s weekly petroleum status report[8]. That would normally support the crude oil price, yet Brent and WTI have continued to slide. Weekly inventory data of this kind tends to have a short-term influence on price compared with structural supply expectations such as OPEC+ quota decisions, which helps explain why the drawdown did little to change the broader trend.
The EIA’s Short-Term Energy Outlook has also flagged a well-supplied second half of the year as Gulf output recovers, broadly in line with the IEA’s view that global oil stocks could fall further before the market shifts to surplus later in 2026[5],[9]. Separately, Fed Chair Kevin Warsh said on 1 July that “prices are too high”[7]. His comments reinforced expectations that US monetary policy could remain restrictive. A firmer US dollar generally weighs on dollar-denominated commodities such as crude oil by making them more expensive for overseas buyers.
See the latest oil price news today and commodity market news here.

Levels to watch
The table below sets out the reference points traders are watching on the Brent oil and WTI crude oil price charts, based on the 4-hour setup used for this analysis. These are observational levels, not trade signals.
| Instrument | 4H Session Range | 50-Period MA | 200-Period MA | RSI (14) |
| UKOUSD (Brent) | 71.844 – 72.206 | 72.467 | 87.259 | 51.54 |
| USOUSD (WTI) | 68.841 – 69.188 | 69.870 | 83.941 | 47.57 |
Table: Brent and WTI reference levels as of 01:50 UTC / 09:50, GMT+8, 7 July 2026. Source: Vantage CFD feed, TradingView. Indicative only.
Brent’s 200-period moving average at 72.467 sits just above the current 72.154 print, while WTI’s equivalent at 69.870 sits above its own 69.138 print. In both cases the 50-period average remains far higher, reflecting how sharply prices have retraced since the highs seen earlier in the year.
What to watch this week and beyond
- OPEC+ Meeting, 2 August 2026: The group’s next scheduled review of quotas and compensation for past overproduction.
- EIA Weekly Petroleum Status Report, 8 July 2026: The next US inventory release, covering the week to 3 July 2026.
- US-Iran Talks, Ongoing: Continued mediation in Doha over Strait of Hormuz shipping and the wider Middle East conflict.
- IEA Oil Market Report, Mid-July 2026: The agency’s next monthly update on the global oil supply and demand balance.
With both benchmarks trading close to their 200-period moving averages, headlines surrounding OPEC+ or the Strait of Hormuz could continue to drive short-term volatility. Traders following UKOUSD and USOUSD may want to review Stop Loss placement relative to the moving averages discussed above.
Oil CFDs are commonly traded with leverage, which can work both for and against a position and always carries the risk of losses exceeding the initial deposit. Position sizing relative to account equity is worth revisiting ahead of the next OPEC+ meeting and EIA release.

RISK WARNING: CFDs are complex financial instruments and carry a high risk of losing money rapidly due to leverage. You should ensure you fully understand the risks involved and carefully consider whether you can afford to take the high risk of losing your money before trading.
Disclaimer: The information is provided for educational purposes only and doesn’t take into account your personal objectives, financial circumstances, or needs. It does not constitute investment advice. We encourage you to seek independent advice if necessary. The information has not been prepared in accordance with legal requirements designed to promote the independence of investment research. No representation or warranty is given as to the accuracy or completeness of any information contained within. This material may contain historical or past performance figures and should not be relied on. Furthermore estimates, forward-looking statements, and forecasts cannot be guaranteed. The information on this site and the products and services offered are not intended for distribution to any person in any country or jurisdiction where such distribution or use would be contrary to local law or regulation.
References
[1] “OPEC+ has agreed a further increase in output – Reuters via Investing.com” https://www.investing.com/commodities/brent-oil Accessed on 07 July 2026.
[2] “Opec+ to raise output for fifth month in August amid uneasy US-Iran truce – The National” https://www.thenationalnews.com/business/energy/2026/07/05/opec-to-raise-output-for-fifth-month-in-august-amid-uneasy-us-iran-truce/ Accessed on 07 July 2026.
[3] “OPEC+ prepares another 188,000 bpd production increase for August – Inspenet” https://inspenet.com/en/news/opec-prepares-another-188000-bpd-production-increase-for-august/ Accessed on 07 July 2026.
[4] “OPEC+ August Output Hike: What It Means for Oil Prices, Gulf Exports and the UAE – Gulf News” https://gulfnews.com/business/energy/oil-prices-and-opec-what-the-august-production-increase-really-means-1.500597628 Accessed on 07 July 2026.
[5] “Oil Market Report – June 2026 – IEA” https://www.iea.org/reports/oil-market-report-june-2026 Accessed on 07 July 2026.
[6] “Brent crude oil – Price – Chart – Historical Data – News – Trading Economics” https://tradingeconomics.com/commodity/brent-crude-oil Accessed on 07 July 2026.
[7] “@LCO.1: ICE Brent Crude (Sep’26) – Stock Price, Quote and News – CNBC” https://www.cnbc.com/quotes/@LCO.1 Accessed on 07 July 2026.
[8] “Weekly Petroleum Status Report – US Energy Information Administration” https://www.eia.gov/petroleum/supply/weekly/ Accessed on 07 July 2026.
[9] “Short-Term Energy Outlook: Global Oil Markets – US Energy Information Administration” https://www.eia.gov/outlooks/steo/report/global_oil.php Accessed on 07 July 2026.