


[DAILY TRADING] SpaceX (SPCX) Analysis 16 July 2026 – SPCX Stock Price Today Holds Near $135 IPO Level Ahead of Starship Flight 13

Vantage Editorial Team >
Vantage Editorial Team >
Vantage is a global, multi-asset broker with a team of in-house writers and market analysts who produce educational and insightful trading content for traders of all levels.
 Updated Thu, 2026 July 16 08:33
![[DAILY TRADING] SpaceX (SPCX) Analysis 16 July 2026 – SPCX Stock Price Today Holds Near $135 IPO Level Ahead of Starship Flight 13](https://www.vantage-markets-apac.com/wp-content/uploads/2026/06/SPCX_hero_19Jun2026.webp)
As of 15:47 (GMT+8) / 07:47 (UTC) on 16 July 2026, the SpaceX stock price today on the Vantage SPCX CFD tracked Space Exploration Technologies Corp (NASDAQ: SPCX) near $135.30 in overnight dealing, a touch below the $135.77 overnight reference level. Here’s the latest news for SpaceX and what the chart shows, not a call on where it goes next.
SPCX went public in the SpaceX IPO on 12 June 2026 at a $135 offer price. Investing.com described it as the largest IPO in US market history, raising roughly $85 billion[1]. The SpaceX share price surged above $225 within days and has since pulled back sharply, closing at $135.27 on 15 July, a 52-week low[2], and 16 July 2026 dealing has stayed close to that mark.
- SPCX traded near $135.30 in overnight dealing on 16 July 2026, just above the 15 July session’s 52-week low of $132.15, with price still under both the 50-period and 200-period moving averages.
- In other SpaceX news today, the stock joined the Nasdaq-100 index on 7 July 2026, a change commentary linked to sizeable passive-fund buying against a thin public float[3].
- The day’s biggest SpaceX Starship news: Starship Flight 13 is scheduled for 16 July, aiming to deploy Starlink V3 satellites commercially for the first time, ahead of which several desks have published bullish valuation estimates[4].
What the Chart Is Showing
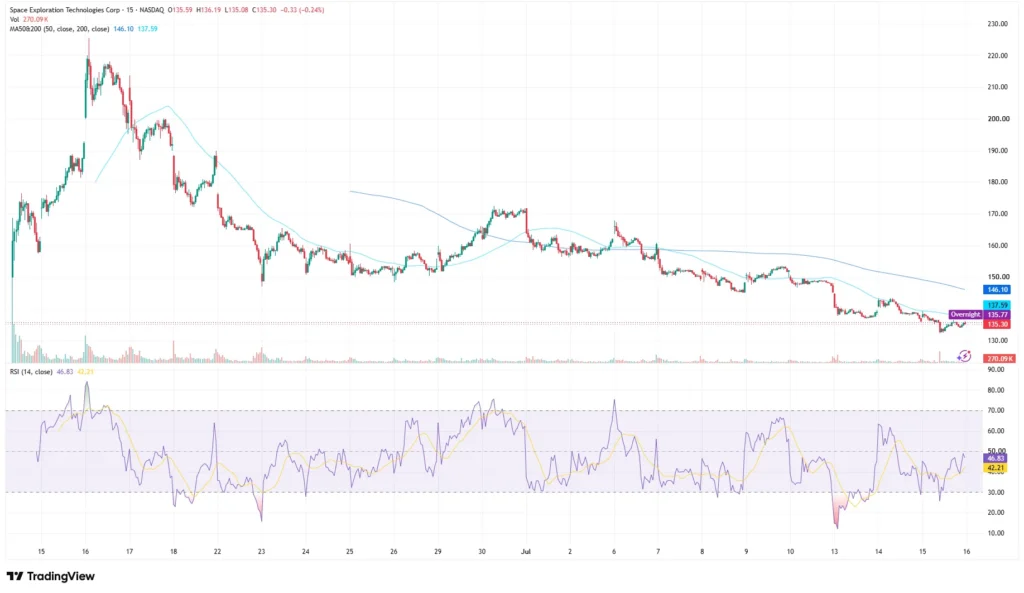
On the 15-minute chart used for this analysis, SPCX opened the session at $135.59, ran up to an intraday high of $136.19, dipped to a low of $135.08, and last traded at $135.30, down $0.33 on the candle[5]. Volume on the most recent bar stood at roughly 270,090 shares, in line with the lighter turnover typical of overnight-session trading.
Both moving averages on the chart sit above the current SpaceX share price: the 50-period MA reads $146.10 and the 200-period MA reads $137.59, per the header of the TradingView setup used for this analysis.
Price has traded beneath the 200-period MA since the post-IPO peak unwound, and the shorter-term average is declining more rapidly than the longer-term one. The RSI (14) reads 46.83, with its moving-average overlay at 42.21, sitting in the middle of the neutral zone rather than at either extreme, consistent with a stock that has stabilised after a sharp drawdown rather than one flashing an active reversal signal.
The SpaceX News Behind Today’s Session

The past month has been a study in extremes. Following its $135 IPO price, SPCX opened for trading at $150 per share on its debut, per CNBC[6], climbed above $225 within a week, and has since given back most of that advance. Its addition to the Nasdaq-100 on 7 July 2026 brought fresh attention: with only an estimated 3% to 5% of shares in public hands, commentary at the time pointed to index funds needing to buy several billion dollars of SpaceX company stock against limited available supply[3].
SpaceX’s first results as a public company showed Q1 2026 revenue of $4.69 billion, up 15% year on year, with Starlink contributing $3.26 billion and passing 10 million subscribers[4]. The company also reported a net loss of $4.3 billion for the quarter, reflecting heavy AI infrastructure spending after the xAI acquisition. The next earnings release, on 6 August 2026, also marks the first lock-up expiry, when roughly 20% of insider shares become saleable[7].
Today’s focus is Starship Flight 13, scheduled for 16 July 2026, which would attempt to deploy Starlink V3 satellites commercially for the first time[4]. Sell-side coverage has been broadly constructive heading into the launch: a compilation of 32 analyst estimates put the average price objective at $232.82, according to Barchart[4], though the spread between desks remains wide, and none of it changes that shares are trading below where they debuted.
Read all latest stock market news here.

Levels to Watch
The table below sets out reference points visible on the chart and in recent reporting on the SpaceX share price. These are observational markers, not signals to act on.
| Reference Point | Level | What’s Happening |
| SPCX overnight price | $135.30 | Trading just above the 15 July session low, near the $135 IPO price |
| 52-week low | $132.15 | Set in the 15 July session, per CNBC data |
| 200-period MA (15-min chart) | $137.59 | Sitting a little above the overnight price, per the TradingView setup used for this analysis |
| 50-period MA (15-min chart) | $146.10 | The nearer overhead reference on the same chart |
Table 1: Reference levels as of 16 July 2026. Sources: TradingView, CNBC. Indicative only.
Both moving averages remain above the current price, with the 50-period average declining more rapidly than the 200-period average. The relationship between the two remains worth monitoring over coming sessions, though the chart alone cannot say which way it eventually resolves.
SPCX has moved more than $90 in either direction within a single month since its debut, and one-dollar-plus ranges within a 15-minute bar have been common through the overnight session covered here. Market participants often monitor how a position on a stock this new and volatile interacts with the rest of a portfolio, particularly where exposure overlaps with other AI-infrastructure or space-sector names.
Leverage on a Vantage SPCX CFD position works both ways in a stock moving like this one: it can amplify gains and just as easily amplify losses. With 6 August also carrying the first insider lock-up expiry, position sizing relative to account equity is worth revisiting well before that date rather than close to it.

RISK WARNING: CFDs are complex financial instruments and carry a high risk of losing money rapidly due to leverage. You should ensure you fully understand the risks involved and carefully consider whether you can afford to take the high risk of losing your money before trading.
Disclaimer: The information is provided for educational purposes only and doesn’t take into account your personal objectives, financial circumstances, or needs. It does not constitute investment advice. We encourage you to seek independent advice if necessary. The information has not been prepared in accordance with legal requirements designed to promote the independence of investment research. No representation or warranty is given as to the accuracy or completeness of any information contained within. This material may contain historical or past performance figures and should not be relied on. Furthermore estimates, forward-looking statements, and forecasts cannot be guaranteed. The information on this site and the products and services offered are not intended for distribution to any person in any country or jurisdiction where such distribution or use would be contrary to local law or regulation.
References
[1] “STARTRADER Lists SpaceX (SPCX) CFD Days After Historic Nasdaq Debut – Investing.com” https://www.investing.com/news/company-news/startrader-lists-spacex-spcx-cfd-days-after-historic-nasdaq-debut-4757401 Accessed on 16 July 2026.
[2] “Space Exploration Technologies Corp. (SPCX) Stock Price, News, Quote & History – Yahoo Finance” https://finance.yahoo.com/quote/SPCX/ Accessed on 16 July 2026.
[3] “SpaceX (SPCX) Stock Price Forecast: $4.3B Nasdaq-100 Forced Buy Hits a 3% Float Stock – TradingKey” https://www.tradingkey.com/analysis/stocks/us-stocks/262011296-spacex-spcx-stock-forecast-july-2026-nasdaq-100-inclusion-tradingkey Accessed on 16 July 2026.
[4] “Dear SpaceX Stock Fans, Mark Your Calendars for July 16 – Barchart” https://www.barchart.com/story/news/3303045/dear-spacex-stock-fans-mark-your-calendars-for-july-16 Accessed on 16 July 2026.
[5] “SPCX 15-Minute Chart – TradingView” https://www.tradingview.com/symbols/NASDAQ-SPCX/ Accessed on 16 July 2026.
[6] “SpaceX stock tanks 16%, extending slump following post-IPO rally – CNBC” https://www.cnbc.com/2026/06/22/spacex-stock-ipo-rally-selloff.html Accessed on 16 July 2026.
[7] “SPCX: Space Exploration Technologies Corp – Stock Price, Quote and News – CNBC” https://www.cnbc.com/quotes/SPCX Accessed on 16 July 2026.