[DAILY TRADING] USDJPY Analysis 30 June 2026 – Yen Trades Near 162.21, Its Weakest Since 1986
Vantage Editorial Team >
Vantage Editorial Team >
Vantage is a global, multi-asset broker with a team of in-house writers and market analysts who produce educational and insightful trading content for traders of all levels.
![[DAILY TRADING] USDJPY Analysis 30 June 2026 – Yen Trades Near 162.21, Its Weakest Since 1986](https://www.vantage-markets-apac.com/wp-content/uploads/2026/06/USDJPY_hero.webp)
USDJPY traded near 162.21 as of 06:00 (GMT+8) on 30 June 2026, with the pair’s last 15-minute close at 03:31 on the Vantage USDJPY CFD feed. The pair has consolidated just below its post-spike high, with the yen near its softest level against the dollar since 1986.
This USD/JPY news today update reads the chart and the macro backdrop shaping the pair. It does not call a trade. Traders monitoring USD/JPY news can do so via the Vantage USDJPY trading page. All prices are as of the stated cut-off time. Charts shown are from TradingView.
Key Points
- USDJPY traded near 162.21 as of 06:00 (GMT+8) on 30 June 2026, holding above both the 50-period and 200-period moving averages on the 15-minute chart, with the pair near its weakest yen level since 1986.
- A sharp intraday spike carried the pair from the low 161.90s toward the 162.40 area before easing back, with the RSI reading 63.73 on the TradingView setup used for this analysis, in bullish territory but not yet overbought.
- Any USD JPY forecast for the week ahead has to weigh Bank of Japan hawkishness against a Federal Reserve on hold at 3.50%–3.75%, keeping the policy rate gap between the two central banks wide for now.
What the chart is showing
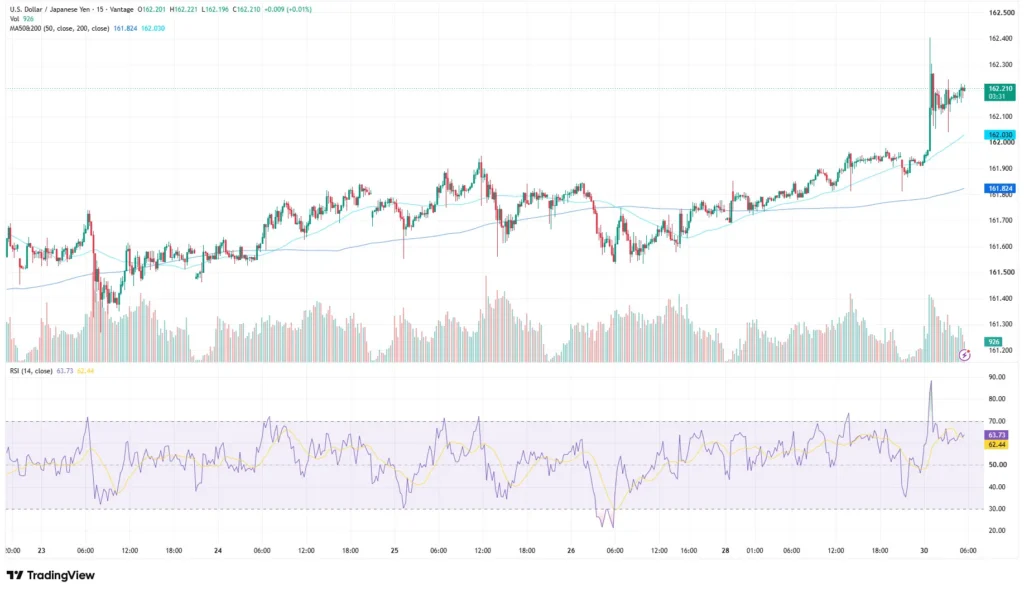
The 15-minute USDJPY chart trended steadily higher in shallow steps through 23 to 29 June 2026, before a sharp vertical move carried the pair from the low 161.90s to an intraday high near 162.40 in the early hours of 30 June 2026. Price has since eased into a tighter band around 162.10 to 162.30.
The Vantage USDJPY CFD live price stood at 162.210 on the 03:31 candle, up 0.01% on the session, with an intraday range of 162.196 to 162.221.[1] The 50-period moving average sits at 161.824 and the 200-period at 162.030, both attributed to the TradingView setup used for this analysis. Price holding above both lines keeps the short-term uptrend intact.
The RSI reads 63.73 against a 62.44 signal line, attributed to the TradingView setup used for this analysis, placing momentum in bullish territory without crossing the overbought zone above 70. Volume on the latest candle stood at 926 contracts, in line with average turnover.
This USD JPY chart is sourced from the TradingView setup used throughout this analysis.
The macro backdrop: BOJ hawkishness meets a Fed on hold

The yen’s weakness continues to reflect the interest-rate differential between Japan and the United States. The Bank of Japan raised its policy rate to 1%, a 31-year high, in June 2026, with broad board support for continued gradual hikes.[2] Board member Naoki Tamura went further on 25 June 2026, arguing the rate should move toward a 2% neutral level at intervals of a few months.[3] Tokyo retail sales rose 5.3% year-on-year in May 2026, the fastest pace since November 2023, reinforcing that case.[4]
The Federal Reserve held its target range at 3.50%–3.75% on 17 June 2026, the first meeting chaired by Kevin Warsh.[5] The BOJ’s next policy meeting runs 30–31 July 2026,[6] the Fed’s next meeting runs 28–29 July 2026,[7] and US Non-Farm Payrolls for June land on 2 July 2026,[8] ahead of both. Separately, a weekend flare-up in Middle East tensions saw the US and Iran exchange strikes near the Strait of Hormuz before agreeing to talks in Doha.[9] Markets see the truce as fragile. See all latest USDJPY news here.
Levels traders are watching
The table below sets out the zones active in today’s session for the USD to JPY pair. These are reference levels, not trade signals.
| Pair | Support | Resistance | What’s happening |
| USDJPY | 161.82 / 161.60 | 162.21 / 162.40 | Trading just under the post-spike high, holding above both moving averages |
Table 1: Levels as of 03:31 on 30 June 2026, drawn from the chart shown above. Source: TradingView, Vantage USDJPY CFD feed. Indicative only.
Holding above 161.824 (the 50-period moving average) has kept the short-term structure intact this week. A close below that line would mark the first meaningful break in the uptrend. The intraday high near 162.40 is the level traders are watching for any retest.
What to watch this week
Track the full economic calendar for upcoming releases. Key dates:
- US Non-Farm Payrolls, 2 July 2026: The June jobs report lands ahead of the Fed and BOJ meetings.
- BOJ policy meeting, 30–31 July 2026: Markets are pricing continued normalisation given recent board commentary.
- FOMC meeting, 28–29 July 2026: The Fed’s first full cycle under Chair Kevin Warsh will be watched for any shift in tone.
- Strait of Hormuz developments: Scheduled US-Iran talks in Doha could ease or reignite regional risk-aversion flows.
On risk management: USDJPY has moved sharply within short windows this week, including the spike toward 162.40. Standard intraday range assumptions may be less reliable while volatility persists.
Stop Loss placement around the levels noted above, and a check of combined exposure across other yen-correlated positions, is worth revisiting given current conditions.
Leverage works both ways in a fast-moving, headline-driven market. Position sizing relative to account equity is worth reviewing ahead of this week’s data, particularly Non-Farm Payrolls.

RISK WARNING: CFDs are complex financial instruments and carry a high risk of losing money rapidly due to leverage. You should ensure you fully understand the risks involved and carefully consider whether you can afford to take the high risk of losing your money before trading.
Disclaimer: The information is provided for educational purposes only and doesn’t take into account your personal objectives, financial circumstances, or needs. It does not constitute investment advice. We encourage you to seek independent advice if necessary. The information has not been prepared in accordance with legal requirements designed to promote the independence of investment research. No representation or warranty is given as to the accuracy or completeness of any information contained within. This material may contain historical or past performance figures and should not be relied on. Furthermore estimates, forward-looking statements, and forecasts cannot be guaranteed. The information on this site and the products and services offered are not intended for distribution to any person in any country or jurisdiction where such distribution or use would be contrary to local law or regulation.
References
[1] “U.S. Dollar / Japanese Yen Chart – TradingView” https://www.tradingview.com/symbols/FX-USDJPY/ Accessed on 30 June 2026.
[2] “Japan Interest Rate – Trading Economics” https://tradingeconomics.com/japan/interest-rate Accessed on 30 June 2026.
[3] “Tamura, Naoki. Speech to Business Leaders in Kobe – Bank of Japan” https://www.boj.or.jp/en/about/press/koen_2026/data/ko260625a1.pdf Accessed on 30 June 2026.
[4] “Japanese Yen – Quote, Chart, Historical Data, News – Trading Economics” https://tradingeconomics.com/japan/currency Accessed on 30 June 2026.
[5] “Federal Reserve issues FOMC statement, 17 June 2026 – Federal Reserve” https://www.federalreserve.gov/newsevents/pressreleases/monetary20260617a.htm Accessed on 30 June 2026.
[6] “Monetary Policy Meetings Schedule – Bank of Japan” https://www.boj.or.jp/en/mopo/mpmsche_minu/index.htm Accessed on 30 June 2026.
[7] “Federal Reserve Meeting Calendars and Information – Federal Reserve” https://www.federalreserve.gov/monetarypolicy/fomccalendars.htm Accessed on 30 June 2026.
[8] “Current Employment Statistics – CES (National) – U.S. Bureau of Labor Statistics” https://www.bls.gov/ces/ Accessed on 30 June 2026.
[9] “U.S. and Iran each announce retaliatory strikes in Iran, Kuwait and Bahrain – NPR” https://www.npr.org/2026/06/27/nx-s1-5872954/us-strikes-iran Accessed on 30 June 2026.
