
Weekly outlook | Important data to offer clarity for markets

Important events this week:
This week will offer important news events, which traders should pay attention to. The interest rate decision from the RBA in Tuesday might offer further insights on the potential momentum of the AUD, which has been under pressure in the past two weeks. Weaker momentum might be persistent in particular due to the slight correction in the equity market.
Also, the JOLTS job openings are important to watch. The last data two month the data has been negative showing the decline of the US economy. If the activity shrinks, less jobs will be available on the market.
Furthermore, also the monthly employment data from the US are important to give further insights. Since the recent two months had also shown negative results with the numbers falling back behind their expectation also this month might not be any better. A negative reading might be seen as positive for traders due to the expectation of the Fed to continue with their rate cut expectations.
– AU – interest rate decision– The Royal Bank of Australia is not expected to cut their interest rate during their meeting this month. The rate might stay at 3.6% and the focus should be on the press conference following the release. Any hints on the future rate path might give clues on the future development and hence move the AUD.
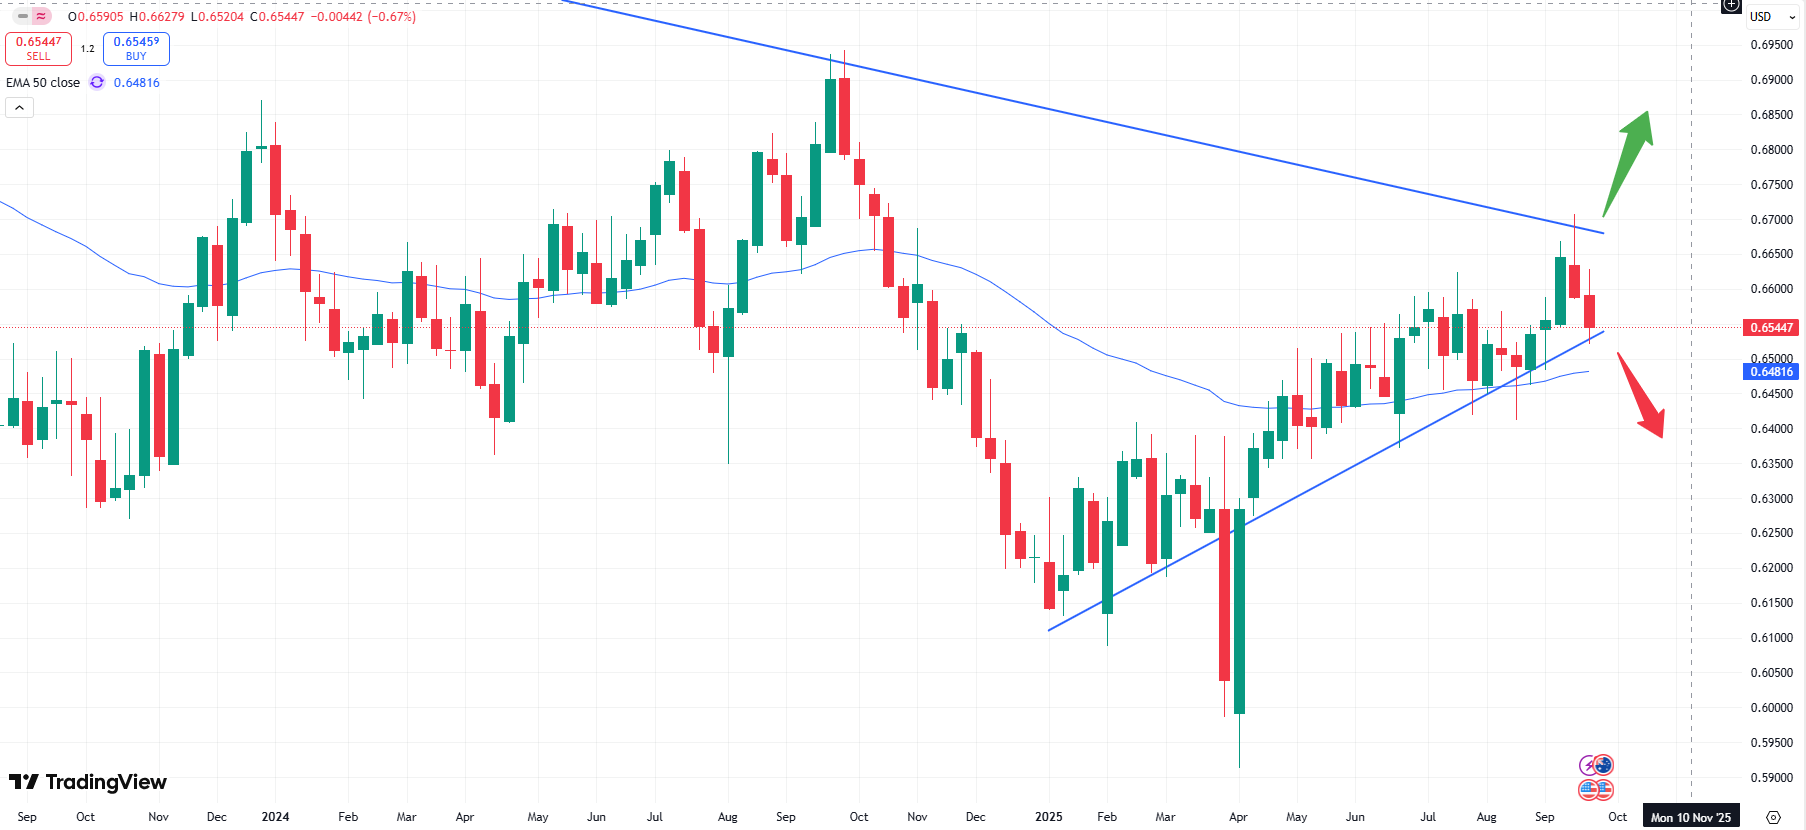
AUDUSD, weekly chart
As the weekly chart above shows, the Aussi has been under slight pressure and might continue to move lower. A break of the technical support zone, seen as the blue rising trendline in the chart above could unleash further pressure. If the support zone at 0.6480 (50- moving average) does not hold, the rate might fall even further, potentially also indicating more pressure for stock markets. The data will be released on Tuesday , September 30 at 06:30 CET.
– US – Nonfarm payrolls report– The NFP report on Friday this week is expected to only offer 51.000 newly created jobs for the US economy. The number is expected higher as compared to the release last month but still lags behind the usual number. This might be more reason for the FED to cut rates to support the economy. Lower interest rates and cheaper access to liquidity usually finds their way into the equity market.
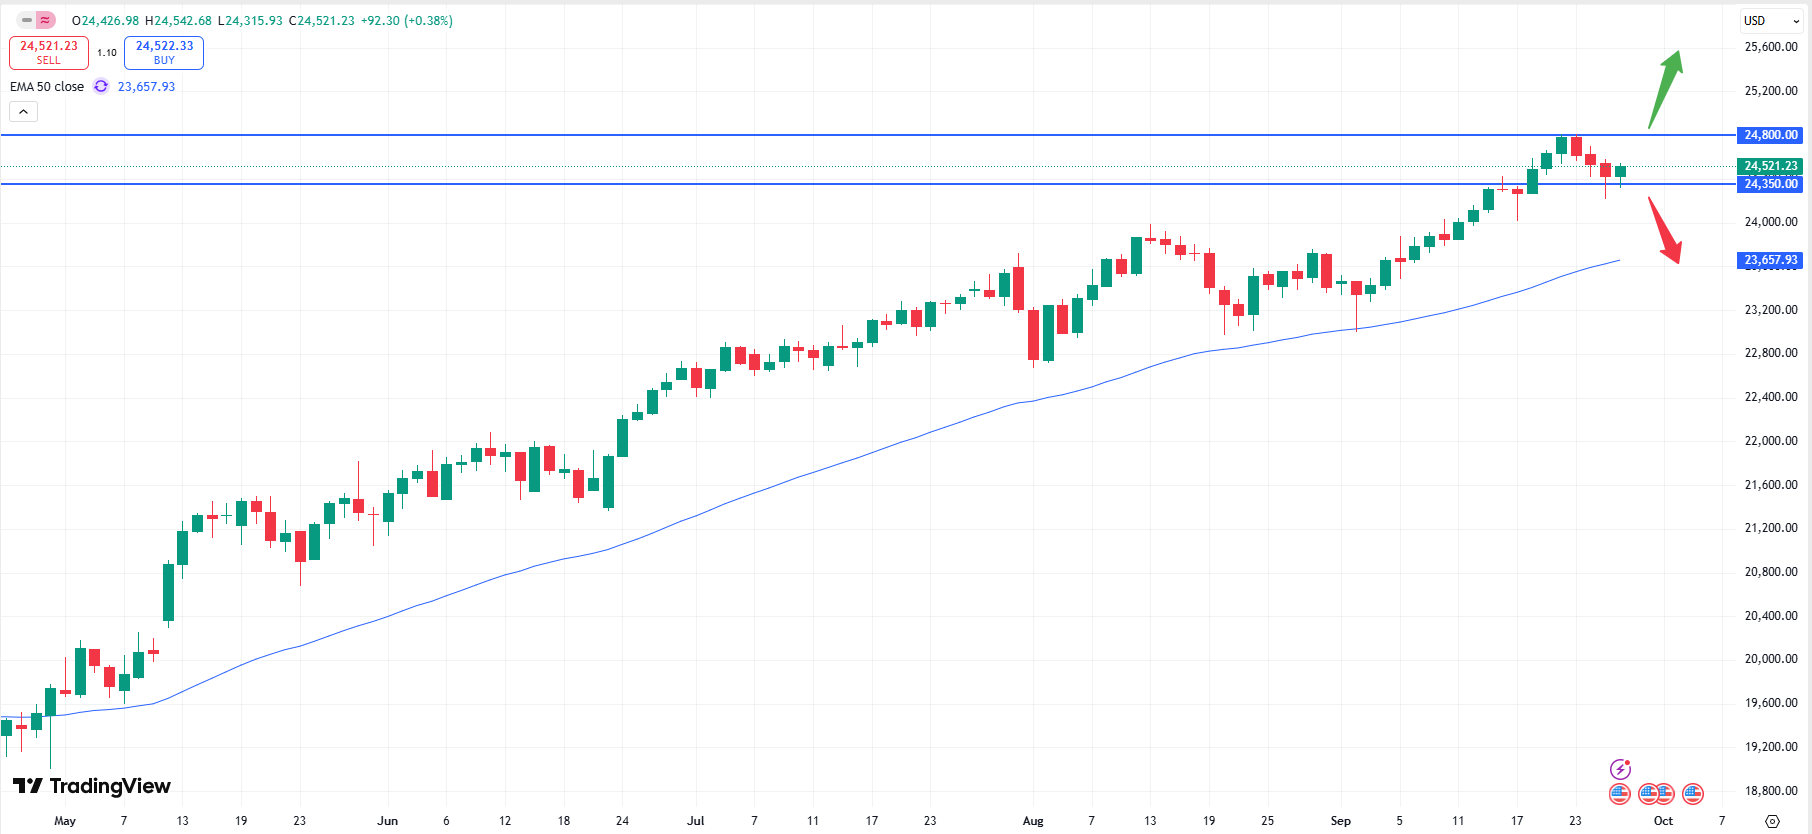
Nasdaq, daily chart
The current trend of the Nasdaq index shows, that the market is capped within a small trading range. Yet, the general positive trend is intact. While the support zone at 24.350 helps the market from falling further, the technical resistance at 24.800 needs to break in order to release fresh upside momentum. Negative data might initially cause the market to weaken slightly but should be seen positive as examined before. The data will be released on Friday, October 03 at 14:30 CET.
