


[DAILY TRADING] Micron (MU) Stock Price Analysis 13 July 2026 – Pre-Market Indication Near $926.55

Vantage Editorial Team >
Vantage Editorial Team >
Vantage is a global, multi-asset broker with a team of in-house writers and market analysts who produce educational and insightful trading content for traders of all levels.
 Updated Mon, 2026 July 13 09:18
![[DAILY TRADING] Micron (MU) Stock Price Analysis 13 July 2026 – Pre-Market Indication Near $926.55](https://www.vantage-markets-apac.com/wp-content/uploads/2026/06/MU_hero_2026-06-23.webp)
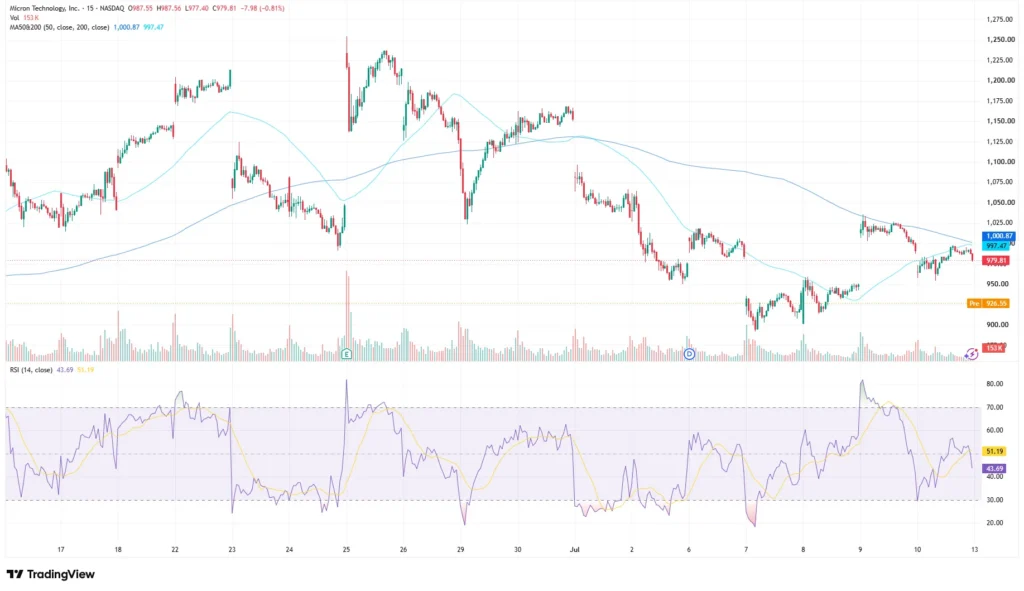
As of 16:25 (GMT+8) / 08:25 UTC on 13 July 2026, the Vantage Micron CFD traded near $979.81 on the 15-minute chart used for this analysis, little changed from Friday’s regular-session close. The TradingView setup used for this analysis also references a separate pre-market indication near $926.55, though that level is not represented by the regular-session candlesticks shown on the chart. Micron technology stock has been one of 2026’s standout AI-memory stories, and the past fortnight has turned choppy.
This piece reads the chart and the latest Micron news. It does not call the trade.
Micron Stock Price: What the 15-Minute Chart Is Showing
The last completed 15-minute candle on the Vantage Micron CFD printed an open of $987.55, a high of $987.56, a low of $977.40 and a close of $979.81, down $7.98, or 0.81%, on the bar. Volume for that candle, attributed to the Vantage CFD feed, came in at 153,000.
The chart’s 50-period moving average sits at $1,000.87 and its 200-period moving average sits at $997.47, both attributed to the TradingView setup used for this analysis. With price trading below both lines, the $997 to $1,001 band now reads as a shelf of overhead resistance rather than support, a change in tone from late June, when the 50-period average was tracking below price during Micron’s run to its late-June record closing high.
Momentum tells a similar story. The Relative Strength Index on the TradingView setup used for this analysis reads 43.69, sitting below its own moving average of 51.19. Neither figure is at an oversold extreme, but the RSI trading under its own moving average points to fading intraday momentum rather than a sharp reversal signal.
The TradingView setup also references a pre-market indication near $926.55, although that level is not represented by the regular-session candlesticks shown. If confirmed once the New York session opens, a move of that size would rank among the sharper pre-market swings in the Micron share price since its late-June earnings report.
Micron News: The Story Behind the Pre-Market Slide
Micron’s fundamentals have not been the problem. The company posted fiscal third-quarter revenue of $41.5 billion, up sharply year over year, and guided to roughly $50 billion for the current quarter[1]. On 9 July 2026, Micron said it would lift its planned US investment to $250 billion through 2035 and add a further $3 billion in supply-chain spending, and shares initially rose on the announcement before slipping back in pre-market trading that same day[1].
Competitive pressure has grown alongside that news. SK Hynix’s American depositary receipts began trading on the Nasdaq on 10 July 2026, in a US listing valued at roughly $29 billion, giving American investors direct access to Micron’s largest high-bandwidth-memory rival for the first time[2]. Samsung and SK Hynix have also pledged roughly $576 billion toward new South Korean fabs and related capacity over the next several years, a scale some analysts see as a longer-term threat to Micron’s pricing power even with near-term memory demand still tight[3].
Positioning has shifted too. Scion Asset Management’s Michael Burry disclosed a direct short position in Micron in early July 2026, entered near $1,051.87, citing the stock’s cyclical history rather than a specific near-term catalyst[4]. Coming so soon after Micron’s record quarter, that combination of a competitor listing, a capacity-spending race, and a high-profile short has coincided with the pullback from its late-June closing high[5].

Micron Share Price: Levels to Watch and Risk Framing
The table below sets out the reference levels visible on the chart used for this analysis. These are levels traders are watching, not trade signals.
| Level | Price | What’s Happening |
| MA50 (50-period) resistance | $1,000.87 | Overhead line per chart legend |
| MA200 (200-period) resistance | $997.47 | Reinforces the $997–$1,001 band |
| Last 15-minute close | $979.81 | Reference point for this analysis |
| Pre-market indication | $926.55 | A separate chart marker, not part of the plotted candlesticks; unconfirmed until the regular session |
Data drawn from the TradingView setup used for this analysis. Accessed on 13 July 2026. Levels are reference points only.
The $997 to $1,001 band, where both moving averages currently sit, is the zone traders are watching on any recovery attempt. The $926.55 level is a pre-market indication that traders may monitor if confirmed during the regular session, since it sits well below Friday’s regular-session range of $954.13 to $998.00[6]. An RSI reading below its own moving average suggests some momentum traders may look for confirmation before treating any early bounce as more than a technical retracement.
Micron’s daily ranges have widened noticeably since its late-June earnings report, and the unconfirmed pre-market indication near $926.55 is a reminder of how quickly that range can move outside normal trading hours.
Traders often monitor support and resistance when determining Stop Loss placement, and the $997–$1,001 resistance band together with the $926.55 pre-market indication identified above are worth watching in that context. Combined exposure across other AI-memory names such as SK Hynix or Samsung-linked instruments is also worth reviewing, given how closely these stocks have moved together through July[7].
Leverage on CFDs such as the Vantage Micron CFD can magnify both gains and losses, and it works both ways in a stock that has moved more than 20% in either direction within a matter of weeks[8]. Position sizing relative to account equity is worth revisiting ahead of the New York open, particularly while the size of Monday’s pre-market gap remains unconfirmed by regular-session trading.
For more on how this Micron technology stock has moved through its recent earnings cycle, see the 23 June Micron stock price analysis and the 1 July Micron stock price analysis from this series.
RISK WARNING: CFDs are complex financial instruments and carry a high risk of losing money rapidly due to leverage. You should ensure you fully understand the risks involved and carefully consider whether you can afford to take the high risk of losing your money before trading.
Disclaimer: The information is provided for educational purposes only and doesn’t take into account your personal objectives, financial circumstances, or needs. It does not constitute investment advice. We encourage you to seek independent advice if necessary. The information has not been prepared in accordance with legal requirements designed to promote the independence of investment research. No representation or warranty is given as to the accuracy or completeness of any information contained within. This material may contain historical or past performance figures and should not be relied on. Furthermore estimates, forward-looking statements, and forecasts cannot be guaranteed. The information on this site and the products and services offered are not intended for distribution to any person in any country or jurisdiction where such distribution or use would be contrary to local law or regulation.

References
[1] “Micron shares rise almost 5% after company announces billions more in U.S. chipmaking investments – CNBC” https://www.cnbc.com/2026/07/09/micron-stock-us-chipmaking.html Accessed on 13 July 2026.
[2] “How Micron and SK Hynix Can Dodge a Memory Meltdown – Bloomberg” https://www.bloomberg.com/opinion/articles/2026-07-07/how-micron-and-sk-hynix-can-dodge-a-memory-meltdown Accessed on 13 July 2026.
[3] “South Korea Says Samsung and SK Hynix Investing in AI, Semiconductor Mega-Projects – CNBC” https://www.cnbc.com/2026/06/29/samsung-sk-hynix-reported-1point3-reported-trillion-spending-plans.html Accessed on 13 July 2026.
[4] “Michael Burry Shorts Micron After 240% Surge Since Start of 2026 – TradingView News” https://www.tradingview.com/news/gurufocus:9ce170837094b:0-michael-burry-shorts-micron-after-240-surge-since-start-of-2026/ Accessed on 13 July 2026.
[5] “Micron, Samsung, SK Hynix Just Dragged Memory Stocks Into a Bear Market – Yahoo Finance” https://finance.yahoo.com/markets/article/micron-samsung-sk-hynix-just-dragged-memory-stocks-into-a-bear-market-154549356.html Accessed on 13 July 2026.
[6] “Micron Stock Price Today – Investing.com” https://www.investing.com/equities/micron-tech Accessed on 13 July 2026.
[7] “Micron Tumbles 13% As South Korean ETF Warning Fuels Chip Sell-Off – Forbes” https://www.forbes.com/sites/antoniopequenoiv/2026/06/23/micron-tumbles-13-as-south-korean-etf-warning-fuels-chip-sell-off/ Accessed on 13 July 2026.
[8] “Micron Now Targets 40% of Its DRAM Output From U.S. Soil – TheStreet” https://www.thestreet.com/latest-news/micron-memory-shortage-us-fab Accessed on 13 July 2026.