US Dollar Index at 13-Month High: What the USDX Chart Shows Now
Vantage Editorial Team >
Vantage Editorial Team >
Vantage is a global, multi-asset broker with a team of in-house writers and market analysts who produce educational and insightful trading content for traders of all levels.

The US Dollar Index CFD (USDX) is trading near 101.15 as of 11:39 UTC (19:39 GMT+8) on 29 June 2026. The index finished the week approximately 0.3% above its Monday opening level, maintaining most of its gains following the June FOMC meeting despite a modest pullback after the PCE release. All prices reference the Vantage USDX CFD. Chart data is from TradingView. This is not financial advice.
Key Points
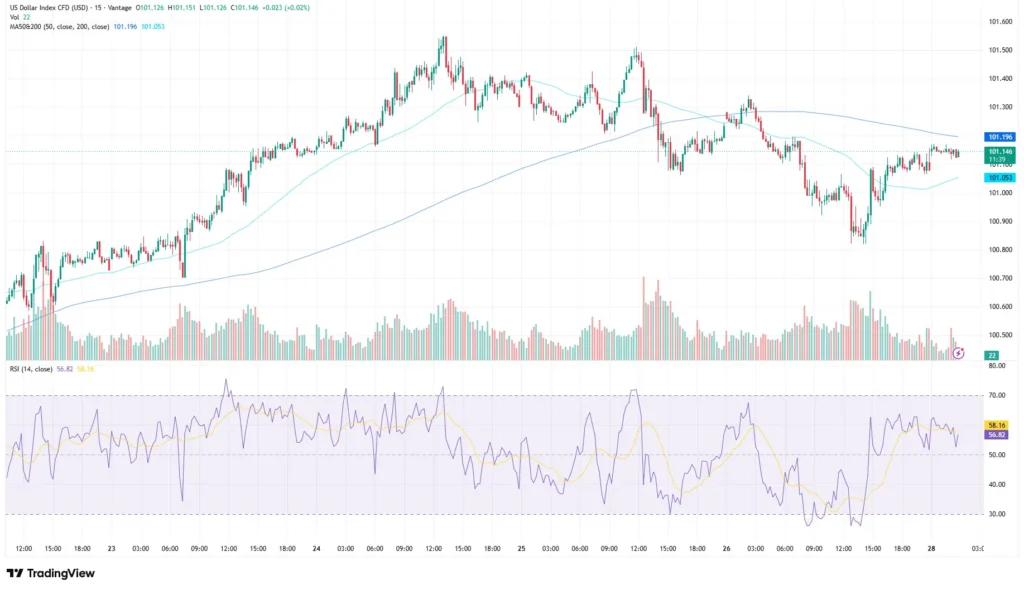
- The US Dollar Index CFD (USDX) traded near 101.15 as of 11:39 UTC+8 on 29 June 2026, consolidating just below the MA50 at 101.196 and above the MA200 at 101.053, according to the TradingView setup used for this analysis.
- The June FOMC held rates at 3.50%–3.75% in a 12-0 vote but nine policymakers projected at least one rate increase this year, while the new Fed Chair did not submit a rate projection, lifting the median year-end rate projection to 3.8%.
- May PCE headline inflation came in at 4.1% year-on-year, broadly in line with expectations, giving markets little new reason to push the dollar sharply in either direction before the 29–30 July FOMC meeting.
What the chart is showing
The US dollar index chart on the 15-minute USDX timeframe covers 22–28 June 2026. Price opened the week near 100.60, rallied sharply into 23 June when the dollar index climbed to a 13-month high around 101.60, then pulled back and consolidated in a 101.00–101.20 range through the end of the week.
As of the cut-off time, the MA50 sits at 101.196 and the MA200 sits at 101.053, per the TradingView setup used for this analysis. Price at 101.146 is between the two: above the longer-term moving average, fractionally below the shorter one. That positioning reflects a market that rallied sharply early in the week before entering a consolidation phase below recent highs.[1]
The RSI (14, close) reads 56.82, with the moving-average overlay at 58.16, per the TradingView setup used for this analysis. Both readings sit in the upper-neutral zone, not overbought, but not retreating sharply either. The RSI crossed above 70 during Tuesday’s spike, returned to mid-range by Friday, and appears to be consolidating rather than showing a confirmed reversal.
Three things driving the dollar this week
The Fed’s hawkish pause
The June FOMC meeting on 17 June 2026 held rates at 3.50%–3.75% in a unanimous 12-0 vote. The decision itself was no surprise. What supported the dollar was the accompanying shift in the Fed’s projections: the dot plot shifted hawkish, with nine policymakers projecting at least one rate hike in 2026, while the new Fed Chair did not submit a rate projection, lifting the median year-end rate forecast to 3.8% from 3.4% in March.[2]
New Chair Kevin Warsh told the post-meeting press conference that the committee had “some work to do on the price stability front.” Markets significantly increased expectations of a September rate hike in response.[3] With leverage amplifying both gains and losses in this kind of event-driven environment, traders monitoring the dollar index should factor in the heightened rate-path sensitivity around data releases.
One nuance worth noting: the FOMC also revised its 2026 PCE inflation forecast up to 3.6% (from 2.7% in March) and nudged GDP lower to 2.2%. The hawkishness is front-loaded; the committee’s projection has inflation returning to 2% by 2028, not sooner.[2]
PCE inflation: hot but not hotter
May PCE headline inflation printed at 4.1% year-on-year, in line with what Bank of America, Goldman Sachs, and UBS expected ahead of the release, according to a Morningstar preview.[4] Core PCE rose 3.4% year-on-year, also within expectations. The data came on 25 June 2026.
Because the data broadly matched expectations, traders trimmed some of the immediate upside momentum in the dollar, the USDX briefly dipped below 101.10 before recovering. New York Fed President John Williams also noted on the same day that inflationary pressures are likely to moderate this year, even as they remain well above the Fed’s 2% target.[5]
Higher energy prices remained one of the primary contributors to headline inflation. US CPI hit 4.2% year-on-year in May, with energy up more than 23% year-on-year linked to the Middle East conflict.[6]
Dollar strength: Fed-driven, not war-driven
J.P. Morgan’s co-head of Global FX Strategy, Meera Chandan, noted in mid-May that after a period of dollar weakness, “there is evidence that the dollar is gaining support from more organic US-specific developments.”[8] That framing still holds. The post-June-FOMC rally in the USDX is a rate story, not a risk-premium story.
The ceasefire framework around the Middle East conflict has held throughout the week, and oil prices have returned to roughly pre-war levels. That removes a portion of the safe-haven support that initially pushed the dollar higher in March. What remains is the rate differential: markets continue to price in the possibility of at least one additional rate increase later this year, and that alone is enough to keep the USDX supported above 100.
Levels and pairs to watch
The table below covers the zones traders are monitoring across the USDX index and major USD pairs. These are reference levels, not trade signals.
| Pair | Support | Resistance | What traders are watching |
| USDX | 101.00 / 100.60 | 101.60 / 101.80 | Near 101.15; MA200 at 101.053 acting as near-term floor |
| EURUSD | 1.1325 / 1.1185 | 1.1390 / 1.1500 | Closed week near 1.1385; broke below 1.1400 medium-term range floor |
| USDJPY | 158.00 / 156.00 | 161.00 / 161.95 | Near highs; J.P. Morgan Q2 forecast 158, Q3 forecast 160, Q4 forecast 164 |
Table 1: Key reference levels as of 11:39 UTC, 29 June 2026. Sources: TradingView, Trading Economics, J.P. Morgan. Indicative only.
- On EURUSD: the pair ended the week at 1.1385 after falling to 1.1324 on 25 June, breaking below the 1.1400 support area of its medium-term 1.1400–1.1850 range. That is the lowest level since summer 2025.[9]
- On USDJPY: the pair consolidated near multi-year highs but remained below the 161.95 barrier that marked the high from 2024. J.P. Morgan’s FX strategy team holds a Q2 2026 forecast of 158, Q3 of 160, and Q4 of 164, noting that the yen outlook remains under pressure while the Fed leans hawkish.[8]
What to watch this week
- US JOLTS job openings, 30 June 2026: First major US labour data point of the week. A softer reading would weigh on the hike narrative; a firm print would reinforce it.
- ISM Manufacturing PMI, 1 July 2026: Any surprise in either direction on manufacturing could move the dollar index, given the Fed’s emphasis on data dependency under Chair Warsh.
- US NFP, 2 July 2026: The main event. May payrolls came in at 172,000, above consensus. Another strong print would likely reinforce the September hike probability; a miss below 100,000 would complicate the picture. US financial markets will observe the Independence Day holiday on 3 July 2026.
- FOMC meeting, 29–30 July 2026: The next rate decision. Incoming data this week will shape the degree of conviction in markets’ current expectations of a September rate hike.
On risk management: the USDX has been reacting sharply to both scheduled data releases and geopolitical headlines this month. Traders often monitor the MA200 near 101.053 together with the 100.60 support zone when determining risk parameters. Stop-loss placement around these technical levels tends to attract attention ahead of high-impact events such as the US non-farm payrolls report on 2 July 2026.
Leverage works in both directions in this kind of data-heavy environment. Leverage can amplify returns but equally amplifies losses, and is not without risk. Position sizing relative to account equity is one factor market participants often revisit ahead of scheduled catalysts such as NFP on 2 July.

RISK WARNING: CFDs are complex financial instruments and carry a high risk of losing money rapidly due to leverage. You should ensure you fully understand the risks involved and carefully consider whether you can afford to take the high risk of losing your money before trading.
Disclaimer: The information is provided for educational purposes only and doesn’t take into account your personal objectives, financial circumstances, or needs. It does not constitute investment advice. We encourage you to seek independent advice if necessary. The information has not been prepared in accordance with legal requirements designed to promote the independence of investment research. No representation or warranty is given as to the accuracy or completeness of any information contained within. This material may contain historical or past performance figures and should not be relied on. Furthermore estimates, forward-looking statements, and forecasts cannot be guaranteed. The information on this site and the products and services offered are not intended for distribution to any person in any country or jurisdiction where such distribution or use would be contrary to local law or regulation.
References
[1] “US Dollar Index CFD (USDX) 15-minute chart – TradingView” https://www.tradingview.com/symbols/TVC-DXY/ Accessed on 29 June 2026.
[2] “Fed interest rate decision June 2026: Fed holds rates steady – CNBC” https://www.cnbc.com/2026/06/17/fed-interest-rate-decision-june-2026.html Accessed on 29 June 2026.
[3] “FOMC June 2026: Fed holds, Warsh debuts hawkish – Raison” https://raison.app/news/analytics/fomc-meeting-summary-april-2026 Accessed on 29 June 2026.
[4] “May PCE expected to show rising inflation – Morningstar” https://www.morningstar.com/economy/may-pce-expected-show-rising-inflation Accessed on 29 June 2026.
[5] “United States Dollar – Trading Economics” https://tradingeconomics.com/united-states/currency Accessed on 29 June 2026.
[6] “Dollar index at 13-month high: USDX chart ahead of PCE data – Vantage Markets” https://www.vantage-markets-apac.com/market-analysis/usdx-us-dollar-index-june-25-2026/ Accessed on 29 June 2026.
[7] “Forex and cryptocurrency forecast for 29 June – 3 July 2026 – NordFX” https://www.mql5.com/en/blogs/post/771985 Accessed on 29 June 2026.
[8] “Currency volatility: dollar strength, euro weakness? – J.P. Morgan” https://www.jpmorgan.com/insights/global-research/currencies/currency-volatility-dollar-strength Accessed on 29 June 2026.
[9] “United States Dollar – Trading Economics” https://tradingeconomics.com/united-states/currency Accessed on 29 June 2026.
