The Analyst’s Read: XAUUSD – Gold’s $4,000 Break Is a Rate Story, Not a War Story
Vantage Editorial Team >
Vantage Editorial Team >
Vantage is a global, multi-asset broker with a team of in-house writers and market analysts who produce educational and insightful trading content for traders of all levels.

The gold price today crossed below $4,000 per ounce on 24 June 2026 for the first time since November 2025. The Vantage XAUUSD CFD last traded near $3,982.66 as of 05:45 UTC on 25 June 2026 (13:45 GMT+8). That is a 29% drawdown from January’s record near $5,600.
Much of the recent commentary has focused on the fading of the geopolitical safe-haven premium. My read goes further: this is primarily a real-rates and dollar event. Much of the geopolitical risk premium has unwound. The Fed has not.
All prices are as of 05:45 UTC, 25 June 2026. This is not financial advice.
What the XAUUSD chart is showing
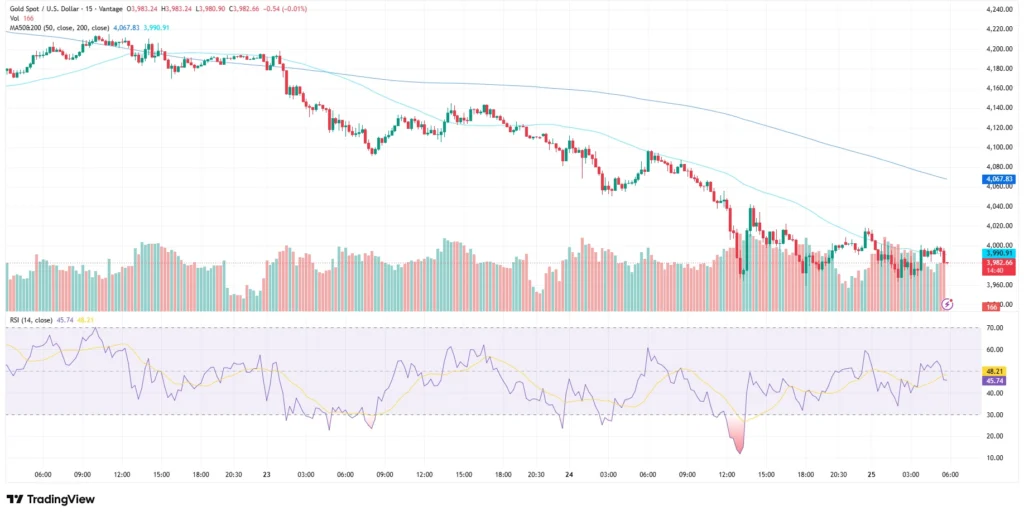
The 15-minute XAUUSD chart covers 22 to 25 June. Two phases define it. Gold traded broadly sideways across the $4,100 to $4,200 region on 22 and 23 June, with the 50-period MA and 200-period MA both tracking higher alongside price.
That picture broke decisively in the 24 June US session: a sustained selloff drove the XAUUSD gold price through both moving averages in a single session, pressing to a low in the $3,940 to $3,960 area on the Vantage XAUUSD CFD before a partial recovery.
As of the chart cut-off, the 200-period MA sits at 3,990.91 and the 50-period MA at 4,067.83. Both are now sloping lower, with the 200-period average declining more sharply than the flatter 50-period average. Both sit above price. That is a bearish short-term structure. The partial bounce has not reclaimed either level.
The RSI (14, close), per the TradingView setup used for this analysis, reads 45.74, with the RSI moving-average overlay at 48.21. Both sit just below the 50 midline. The RSI spiked into single digits during the steepest part of the 24 June drop before recovering. Not oversold at current levels. Not recovering with conviction either.
Join our online free trading webinars hosted by trading professionals. Reserve your seat today. Open to all new and existing Vantage clients.
The macro backdrop: Fed, real yields, and the fading risk premium
The Federal Reserve held rates at 3.50%-3.75% on 17 June 2026, unanimously (12-0), in Kevin Warsh’s first meeting as Chair. The projections underneath were not neutral: nine of 18 FOMC participants projected at least one rate hike before year-end, with the median dot shifting to 3.8% from 3.4% in March 2026. The committee removed easing-bias language entirely.[1]
For gold news watchers, this matters through one channel: the opportunity cost of holding a non-yielding asset rises when rate expectations shift hawkish and the dollar follows. The US dollar index pushed above 101 following the June meeting,[2] while rising Treasury yields lifted real rates and tightened the financial conditions that gold trades against.[1]
The inflation picture has kept the pressure on. Headline CPI ran at 4.2% year-on-year in May 2026, driven by energy costs up 23.5% following the Middle East conflict shock.[3] Core PCE stood at 3.3% year-on-year in April, per the Bureau of Economic Analysis.[4] The May PCE reading is due from the BEA today, 25 June 2026, and it is the single data release most likely to move XAUUSD gold price in the near term.
The piece of the puzzle most commentary is missing: the same conflict that drove oil and inflation higher is now easing. A 60-day US-Iran peace roadmap has been signed, and Brent crude fell to its lowest level since late February on 24 June, with vessels transiting the Strait of Hormuz.[5] Easing oil pressure reduces the stagflationary argument that had been one of gold’s main supports.
Goldman Sachs analysts Lina Thomas and Daan Struyven cut the bank’s year-end 2026 gold forecast to $4,900 from $5,400 on 19 June, citing fading ETF inflows and the removal of all 2026 rate cuts from the bank’s forecast.[6] Deutsche Bank analyst Michael Hsueh revised the bank’s Q3 forecast to $4,300 and Q4 to $4,800, flagging a downside scenario near $3,800 if the Fed delivers three to four hikes.[7]
Where the chart and the macro agree
The technical picture and the fundamental backdrop are aligned.
On the chart: both MAs declining above price, RSI sub-50, the partial bounce not reclaiming the 200-period MA. On the macro: a hawkish dot plot, elevated real yields, a dollar at near one-year highs,[2] and much of the geopolitical risk premium unwinding as the Middle East conflict moves toward negotiation.
CME FedWatch data cited in market reports placed the September rate hike probability near 68%, up from 29% a week prior.[5] Britannia Global Markets noted in Investing.com’s 24 June reporting that a stronger dollar and repriced rate expectations are keeping pressure on the complex.[5] That matches what the XAUUSD chart is showing.
Levels to watch and risk framing
Key levels on the Vantage XAUUSD CFD as of 05:45 UTC, 25 June 2026. Reference only, not trade signals.
| Zone | XAUUSD Price | Context |
| Resistance 1 | 3,990 – 4,000 | 200-period MA (3,990.91) + $4,000 round figure |
| Resistance 2 | ~4,067 | 50-period MA (4,067.83), declining |
| Support 1 | 3,940 – 3,960 | 24 June session low on Vantage CFD |
| Support 2 | ~3,885 – 3,900 | Technical zone cited by FXStreet analysis |
| Downside scenario | ~3,800 | Deutsche Bank estimate (analyst Michael Hsueh) if the Fed hikes three to four times; base case Q4 2026 at $4,800 |
Table 1: XAUUSD key levels as of 05:45 UTC, 25 June 2026. Sources: Vantage XAUUSD CFD, TradingView, Deutsche Bank, FXStreet. Indicative only.
What to watch next:
- PCE Price Index, 25 June 2026 (08:30 EDT, BEA): A hotter print reinforces hike pricing and extends dollar pressure on gold price news. A softer result reduces hike probability.
- Revised Q1 GDP, 26 June 2026: Weak growth alongside sticky inflation creates a stagflationary read – historically complex for gold.
- US-Iran peace talks, ongoing: Any deterioration in the 60-day roadmap would reignite energy-driven inflation concerns and reshape the rate outlook.
Gold shed over $100 in a single session on 24 June 2026. Intraday range assumptions break down around data releases of this significance. Traders following XAUUSD gold market news through the Vantage CFD should review Stop Loss placement with the $4,000 level and the 200-period MA at 3,990.91 as the first reference zones for short-term exposure management.
Leverage amplifies both gains and losses in proportion to the position size held. In a session where XAUUSD moved over $100 intraday, leveraged exposure magnifies that range in both directions. Reviewing position sizing relative to account equity is relevant ahead of today’s PCE release. Leverage in CFD trading is a double-edged instrument.
RISK WARNING: CFDs are complex financial instruments and carry a high risk of losing money rapidly due to leverage. You should ensure you fully understand the risks involved and carefully consider whether you can afford to take the high risk of losing your money before trading.
Disclaimer: The information is provided for educational purposes only and doesn’t take into account your personal objectives, financial circumstances, or needs. It does not constitute investment advice. We encourage you to seek independent advice if necessary. The information has not been prepared in accordance with legal requirements designed to promote the independence of investment research. No representation or warranty is given as to the accuracy or completeness of any information contained within. This material may contain historical or past performance figures and should not be relied on. Furthermore estimates, forward-looking statements, and forecasts cannot be guaranteed. The information on this site and the products and services offered are not intended for distribution to any person in any country or jurisdiction where such distribution or use would be contrary to local law or regulation.
References
[1] “Fed interest rate decision June 2026: Fed holds rates steady – CNBC” https://www.cnbc.com/2026/06/17/fed-interest-rate-decision-june-2026.html Accessed on 25 June 2026.
[2] “A surging dollar has swept past chart resistance – Reuters via Investing.com” https://www.investing.com/currencies/xau-usd Accessed on 25 June 2026.
[3] “Consumer Price Index Summary – May 2026 – Bureau of Labor Statistics” https://www.bls.gov/news.release/cpi.nr0.htm Accessed on 25 June 2026.
[4] “Personal Consumption Expenditures Price Index, Excluding Food and Energy – Bureau of Economic Analysis” https://www.bea.gov/data/personal-consumption-expenditures-price-index-excluding-food-and-energy Accessed on 25 June 2026.
[5] “Gold slides, with spot prices under $4,000/oz for the first time since November – Investing.com” https://www.investing.com/news/commodities-news/gold-falls-toward-4000oz-as-dollar-rallies-on-fed-tightening-bets-4757323 Accessed on 25 June 2026.
[6] “Goldman Sachs Reduced Its Gold Price Target for the End of 2026 – Yahoo Finance / Bloomberg” https://finance.yahoo.com/markets/commodities/articles/goldman-sachs-reduced-gold-price-115703189.html Accessed on 25 June 2026.
[7] “Deutsche Bank Cuts Gold Forecasts up to 22% as Bulls Temper View – Bloomberg” https://finance.yahoo.com/markets/commodities/articles/gold-bulls-gut-outlooks-deutsche-083246040.html Accessed on 25 June 2026.
